Which countries have accumulated the most private debt since 2008?

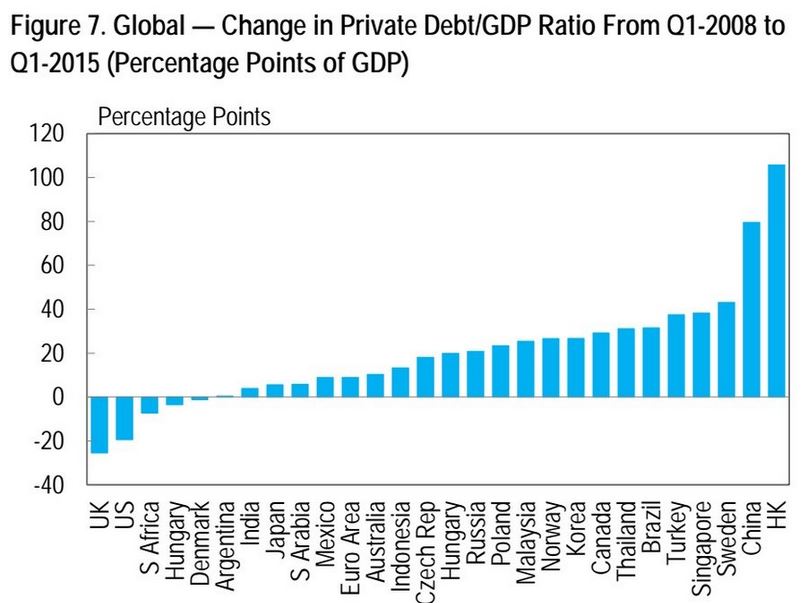
Citi Research’s latest global economic outlook is out, and it’s crammed full of interesting data and charts on the state of the world right now. One of those charts shows how much private debt countries have accumulated since 2008.
Some countries have de-leveraged — reduced their debt levels — though not very many. The UK comes out as the most serious debt reducer, according to Citi, cutting private debt levels by over a fifth of GDP. The US has also seen genuine reductions.
China and Hong Kong comes out on the other end of the scale, having increased private debt by more like 80-100% of GDP, thanks to an explosion in corporate borrowing that Beijing is now trying to restrain.
The graph shows private debt accumulation from the first quarter of 2008 to the first quarter of 2015, and it’s in terms of each country’s GDP, so the figures are comparable:
This article is published in collaboration with Business Insider. Publication does not imply endorsement of views by the World Economic Forum.
To keep up with the Agenda subscribe to our weekly newsletter.
Author: Mike Bird is a European markets editor.
Image: A customer performs a transaction on an ATM. REUTERS/Laszlo Balogh.
Don't miss any update on this topic
Create a free account and access your personalized content collection with our latest publications and analyses.
License and Republishing
World Economic Forum articles may be republished in accordance with the Creative Commons Attribution-NonCommercial-NoDerivatives 4.0 International Public License, and in accordance with our Terms of Use.
The views expressed in this article are those of the author alone and not the World Economic Forum.
Stay up to date:
Geo-economics
Related topics:
Forum Stories newsletter
Bringing you weekly curated insights and analysis on the global issues that matter.
More on Economic GrowthSee all
Council on the Future of Growth and 2023-2024
December 20, 2024


