15 of the CIA’s most intriguing declassified maps
Cartographic support was key to the US war effort
Image: CIA/Flickr
Stay up to date:
Youth Perspectives
During key events in history, maps created by the Central Intelligence Agency (CIA) have helped US presidents and their advisors make critical decisions.
These maps, usually top secret, were produced by the CIA’s own Cartography Center, which was set up in 1941 to provide maps, geographic analysis and research to support the work of the Agency, the White House, senior policy-makers and the intelligence community at large.
The Center started life with only one employee, but such was the demand that one year later there were 28 people working there.
In order to celebrate the Center’s 75th anniversary, the CIA has released a series of maps, from the 1940s up to the 2010s.
War planning
Cartographic support was key to US war planning.
By December 1941 the Americans had joined World War II, and were producing maps such as this one of the Russian Front, to support the war effort.
This map, meanwhile, shows key information used during the Cuban Missile Crisis in 1962.
The maps became more sophisticated as time went on, such as this 3D map of Afghanistan from 2001.
People
But the CIA’s maps aren’t just geographical, they also tell us about governments and people, such as this 1950 map of administrative regions in Africa.
Or this 2000 map of the Balkan region.
This 1980 map shows ethnic groups in Afghanistan.
Commodities
The CIA also produced maps that track the world’s commodities – both legal and illegal.
This 1980s map shows the oilfields, pipelines and tanker terminals of Indonesia.
And this 1992 map shows China’s coal deposits.
This 1950s map shows the production and trade of vegetable tannins across the world.
This map shows cocaine trafficking routes across the US, South America and Europe in 1989.
The natural world
The CIA’s maps have also helped to keep track of the natural world, such as the state of the elephant population in Africa in 2013.

As well as key information on the ivory trade.

There are maps containing geographical data, such as the depth of water in the East China Sea, and the path of a hurricane.

This map shows the route of hurricane Mitch which hit Central America in 1998.

Health
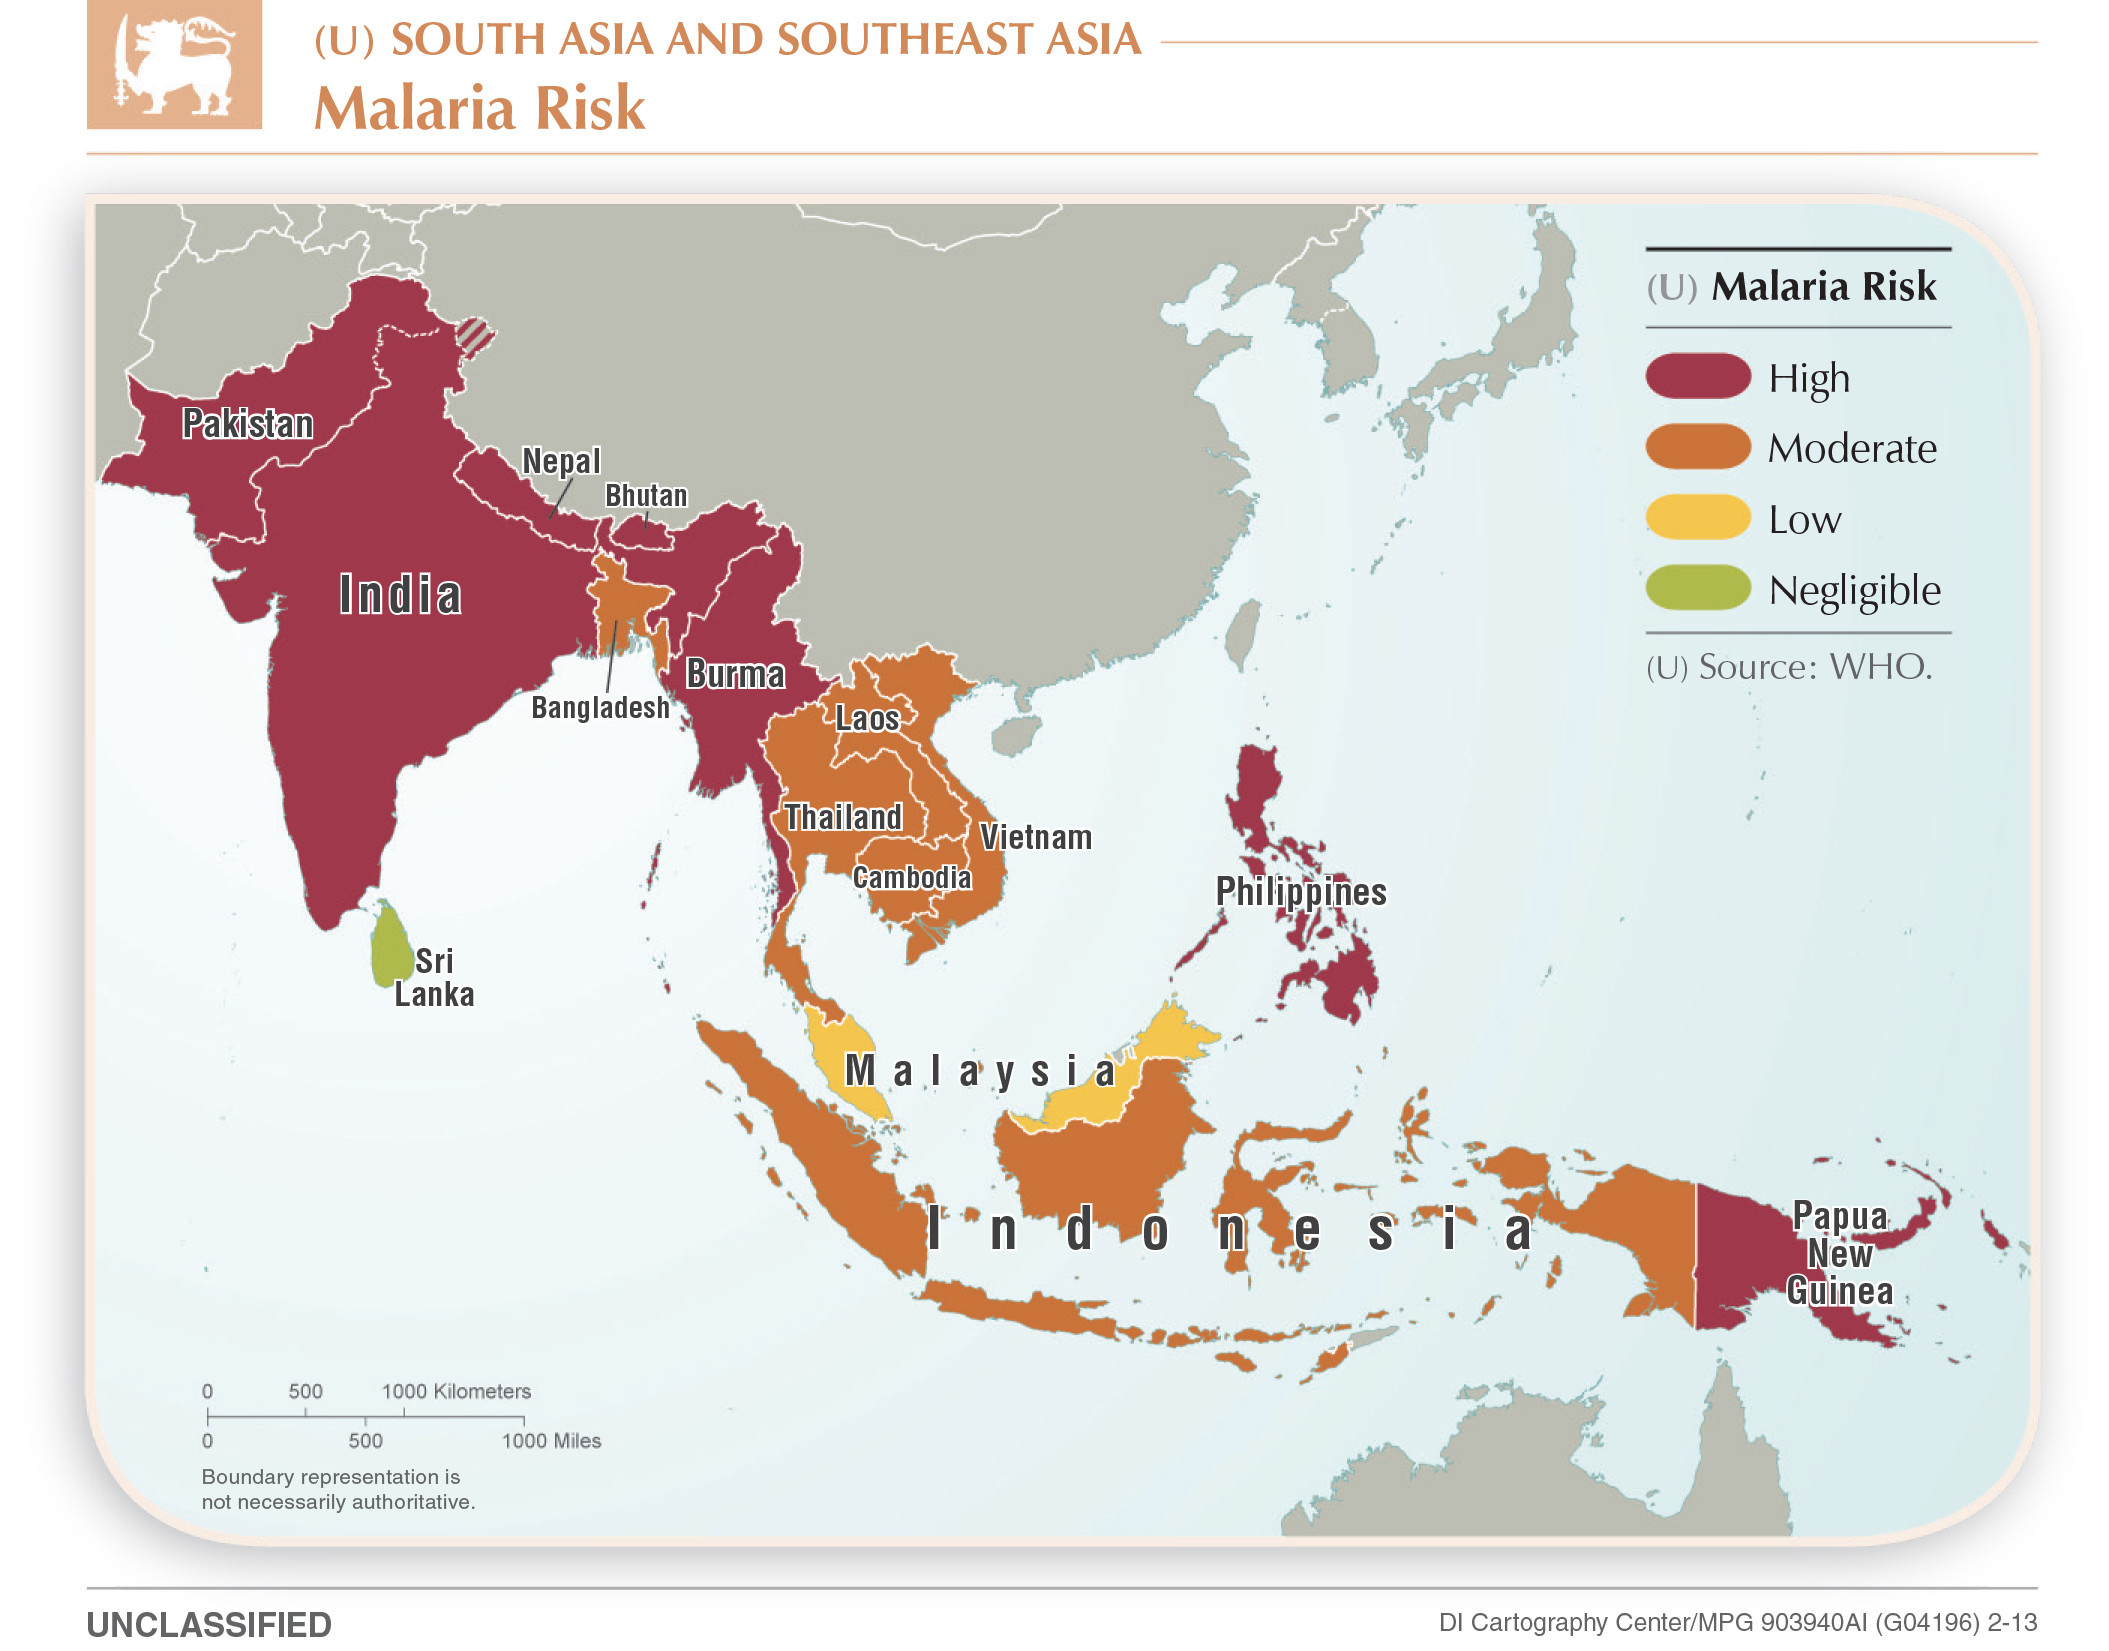
The CIA also mapped health issues, such as this 2013 map which shows malaria risk across South and Southeast Asia.

You can see more of the Center’s maps here.
Don't miss any update on this topic
Create a free account and access your personalized content collection with our latest publications and analyses.
License and Republishing
World Economic Forum articles may be republished in accordance with the Creative Commons Attribution-NonCommercial-NoDerivatives 4.0 International Public License, and in accordance with our Terms of Use.
The views expressed in this article are those of the author alone and not the World Economic Forum.
Related topics:
Forum Stories newsletter
Bringing you weekly curated insights and analysis on the global issues that matter.
More on Economic GrowthSee all
Stephanie Holmes, Pooja Chhabria and John Letzing
June 26, 2025
Chris Hamill-Stewart
June 25, 2025
Tariq Bin Hendi
June 25, 2025
John Letzing
June 25, 2025
Claire Poole
June 24, 2025
Gim Huay Neo
June 24, 2025


