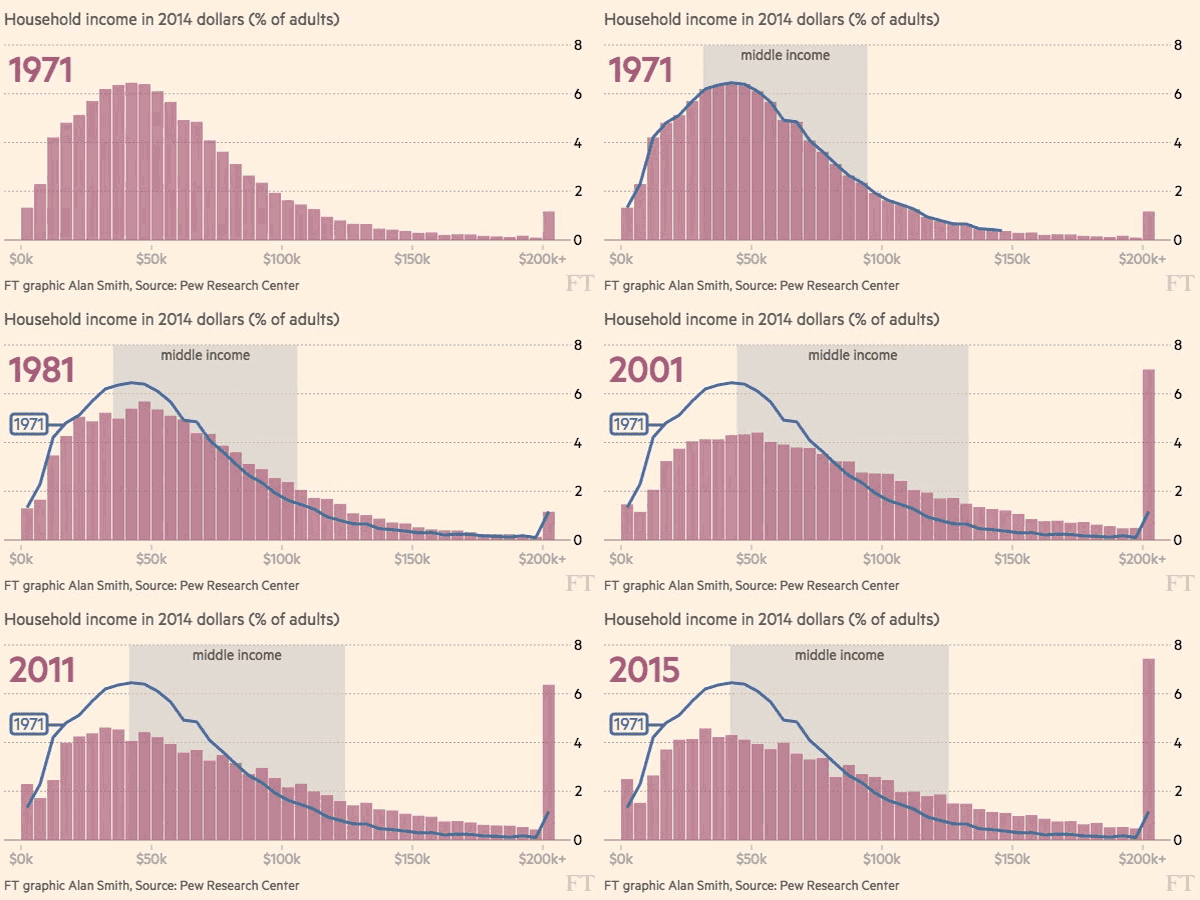
Watch what has happened to the US middle class since 1970

Changing perspectives: the number of middle income earners has been squeezed
Image: REUTERS/Eric Thayer
Stay up to date:
United States
Accept our marketing cookies to access this content.
These cookies are currently disabled in your browser.
Since 1970, the US economy has grown significantly larger. Real US GDP per capita, a measure of the country’s average income, has more than doubled. However, the median household income, a measure of what the typical American family earns, has not kept up. Across the US, median household income has increased by only about 20% over the same period.
Such a large disparity between the average and median incomes is possible because the economic gains have not been shared evenly. They have been realized predominantly by high-income households, with only a small share going to the lower majority of the income spectrum. The result is an income distribution that looks like it’s been “squashed,” as illustrated brilliantly in this animated chart by the FT.

This trend is not only happening at the nationwide level. Income distributions within individual cities are also being flattened.
Since 1970, some cities, such as San Francisco, have fared well economically. Others, such as Detroit, have struggled. But nearly without exception, American cities have seen a sharp rise in inequality — a widening gap between those at the top of the income spectrum and those at the bottom.
Like the map above, this graphic shows the distribution of median household income across each city’s Census tracts. It includes the eight cities from the map as well as 12 additional major US cities.

In 1970, each of these cities shows a near-symmetrical, bell-shaped income distribution — a high concentration of people in the middle, with a narrow tail of low and high-income households on either end.
As of 2015, the distribution of each city has been compressed. The concentration of middle-income households in the center has been squashed down and pushed out to one or both extremes — fewer middle-income households, more households in the low-income and/or high-income strata.
Contrary to the prevailing view that America’s middle class is in terrible shape, the typical US household today is earning about 20% more than in 1970, after adjusting for inflation. That’s small relative to the growth of the economy and even smaller compared to the income growth seen at the top of the spectrum. But it means the middle class is no worse off today income-wise than in 1970. So, to say the middle class is being “crushed” may be a stretch. On the other hand, there are real societal costs when wealth is distributed in a way that is perceived as unfair.
These contrasting views are explained well in the posts below, both from people I greatly respect:
- Controversial essay by Paul Graham, founder of the startup accelerator Y Combinator, essentially arguing that as long as a society has economic mobility, inequality is a good thing. It’s drives of innovation and fuels the country’s economic engine.
- Article by Nobel laureate Joseph Stiglitz, someone I had the pleasure of meeting a few years ago, discussing inequality not as merely an economic problem, but one that comes down to fairness and social cohesion.
Notes
- Household income data comes from: LTDB at Brown University and IPUMS National Historical Geographic Information System.
- For some of the cities, I used the urban agglomeration boundaries (as defined by the US Census), rather than the boundaries of the city proper. In these cases, the cities’ administrative boundaries included large areas of non-urban land, some of which may not have had tract-level data available as far back as 1970.
Don't miss any update on this topic
Create a free account and access your personalized content collection with our latest publications and analyses.
License and Republishing
World Economic Forum articles may be republished in accordance with the Creative Commons Attribution-NonCommercial-NoDerivatives 4.0 International Public License, and in accordance with our Terms of Use.
The views expressed in this article are those of the author alone and not the World Economic Forum.
Related topics:
Forum Stories newsletter
Bringing you weekly curated insights and analysis on the global issues that matter.
More on Economic GrowthSee all
Luis Antonio Ramirez Garcia
April 24, 2025
Khalid Alaamer
April 22, 2025
Jai Shroff
April 22, 2025
Samir Saran and Anirban Sarma
April 17, 2025
Lucia Fry and Naomi Nyamweya
April 17, 2025


