These 4 charts show the state of renewable energy in 2022

A record amount of renewable capacity was installed in 2021.
Image: Unsplash/Nicholas Doherty
Stay up to date:
Energy Transition
Listen to the article
- Renewable energy installations broke new records in 2021, according to the International Energy Agency.
- And despite rising raw material costs, installations are expected to rise by 8% in 2022.
- Solar is expected to account for 60% of the increase in global renewable capacity this year.
Nothing, it seems, can hold back the advance of renewable energy. A record amount of renewable capacity was installed in 2021, despite post-pandemic delays and rising raw material costs.
Now the International Energy Agency (IEA) expects that record to be beaten again in 2022, at least in part as nations that have relied on fossil fuels from Russia, push ahead with new renewable capacity in response to the war in Ukraine.
Renewable energy growth means the world now has 295 gigawatts of green generating capacity, says the IEA, demonstrating what the World Economic Forum’s Fostering Effective Energy Transition 2021 report described as its “unprecedented acceleration” in recent years.
As the transition to clean energy gathers pace, it can be difficult to see the full picture. These four charts reveal the state of renewable energy around the world today.
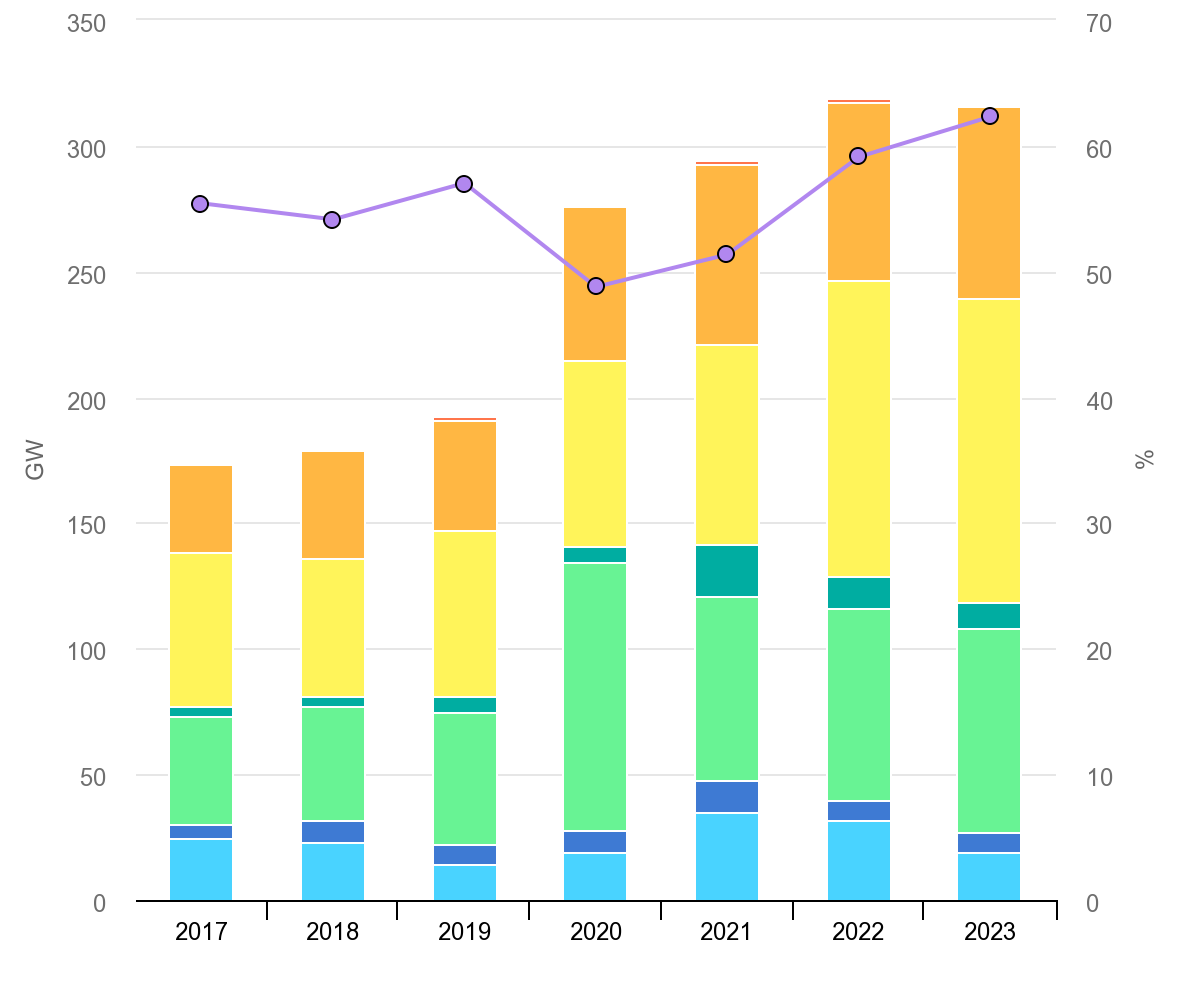
The IEA says 2021’s 6% growth will be followed by an 8% rise in installed capacity in 2022, led by a surge in solar power. However, progress has been uneven, with a 17% decline in new wind installations in 2021 offset by the rise in solar and hydropower.
In India, the rate of growth in renewable energy doubled in 2021 after a record slowdown in 2020 caused by the impact of COVID-19 on projects. Brazil’s incentives led to a growth in rooftop solar and onshore wind also accelerated, the IEA said.
The power of government initiatives to help or harm renewable roll-outs was demonstrated in Viet Nam, where the ending of a feed-in tariff for rooftop solar saw a dramatic slowdown; while in South Africa, the completion of pre-approved wind and solar led to resumed growth.
Solar’s price advantage

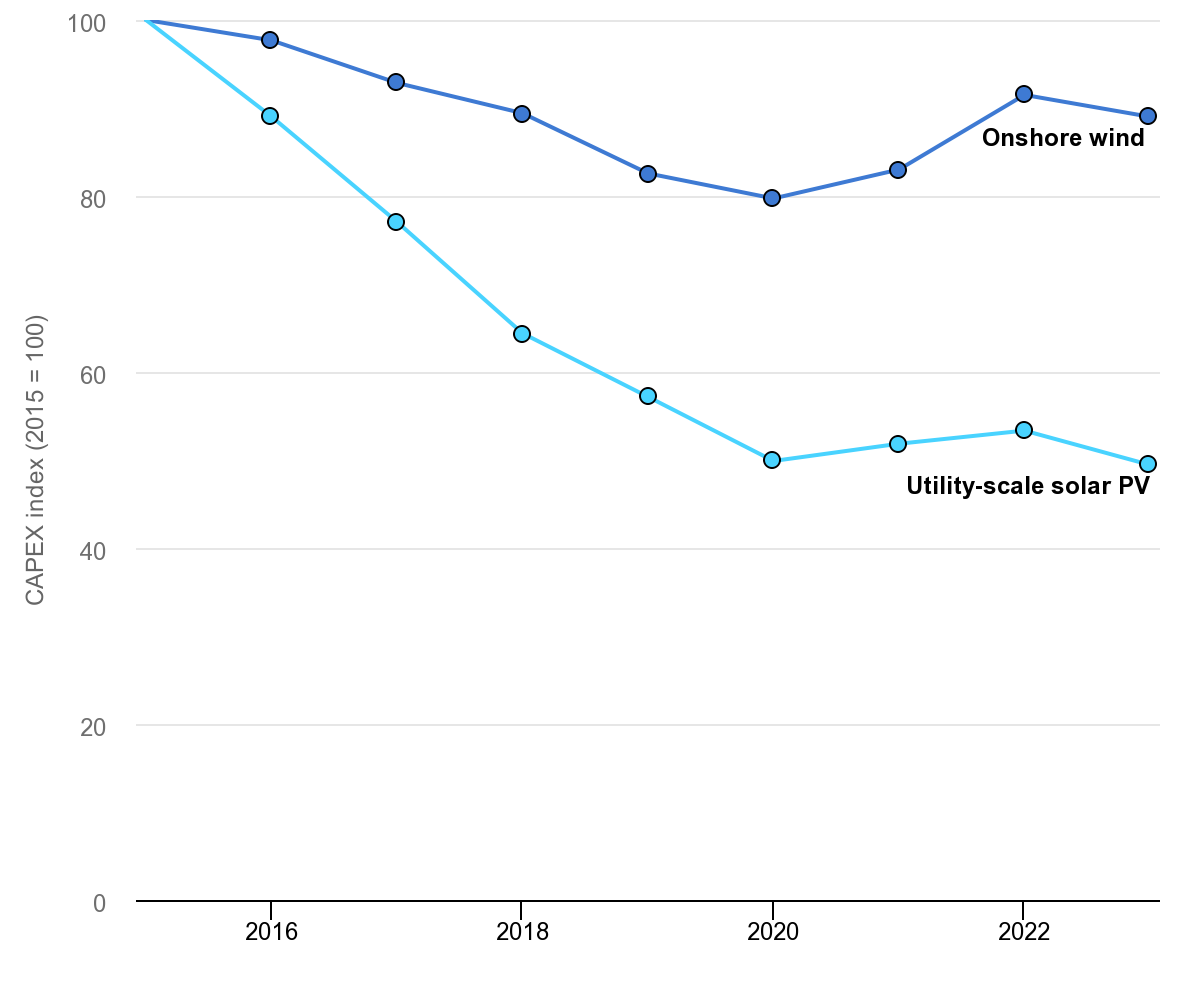
Even if current high energy prices are maintained, the IEA says solar will retain and even increase its cost advantage over the next two years. This is despite the rising cost of raw materials used to construct renewable energy installations.
In the past 12 months, the cost of polysilicon used in solar panels has more than quadrupled, says the IEA, while the price of steel rose by 50% and copper by 70%. Overall, raw material costs for all types of renewable energy were 15% to 25% higher, the IEA says.
China still the leader
China accounted for 46% of the new generating capacity added in 2021, with subsidies encouraging record-breaking rises in the amount of offshore wind which increased sixfold. In Europe, solar accounted for most of the growth, with projects in Spain, France, Poland and Germany.
The IEA expects Russia’s invasion of Ukraine to lead to increases in renewable energy capacity, particularly in Europe. Russia, which supplies around 45% of the European Union’s gas, has already cut supplies to Bulgaria, Finland and Poland.
Incremental growth in renewable capacity in Europe by 2023 could almost entirely replace electricity generation, which is currently powered by Russian gas, says the IEA. Even on current trends renewables could reduce dependence on Russian gas “significantly”, it says.
Solar's ahead of the pack
Solar is expected to account for 60% of the increase in global renewable capacity in 2022, taking the global total to more than 300 gigawatts. Two-thirds will be large-scale projects encouraged by policies in China and the European Union, says the IEA.
New onshore wind capacity is also expected to recover after slipping back in 2021, but the global rate at which new offshore wind installations are built will slow significantly, reflecting the end of subsidies in China which drove a record capacity surge in 2021.
Even so, China’s total installed offshore wind capacity globally is expected to surpass the European Union and United Kingdom combined by the end of 2022.
As the largest player in renewables, events in China have an effect on global totals. The IEA says additions to the world’s hydropower capacity will be 40% lower in 2022 as the number of new projects in China falls.
How is the World Economic Forum facilitating the transition to clean energy?
Accept our marketing cookies to access this content.
These cookies are currently disabled in your browser.
Don't miss any update on this topic
Create a free account and access your personalized content collection with our latest publications and analyses.
License and Republishing
World Economic Forum articles may be republished in accordance with the Creative Commons Attribution-NonCommercial-NoDerivatives 4.0 International Public License, and in accordance with our Terms of Use.
The views expressed in this article are those of the author alone and not the World Economic Forum.
Related topics:
Forum Stories newsletter
Bringing you weekly curated insights and analysis on the global issues that matter.
More on Energy TransitionSee all
Philippe Valahu
April 21, 2025
Dany Qian
April 15, 2025
Charlotte Edmond
April 14, 2025
Michelle You
April 10, 2025


