30 years of sea level rise in 2 charts

The speed of sea level rise has quickened again over the last decade to 3.9mm a year.
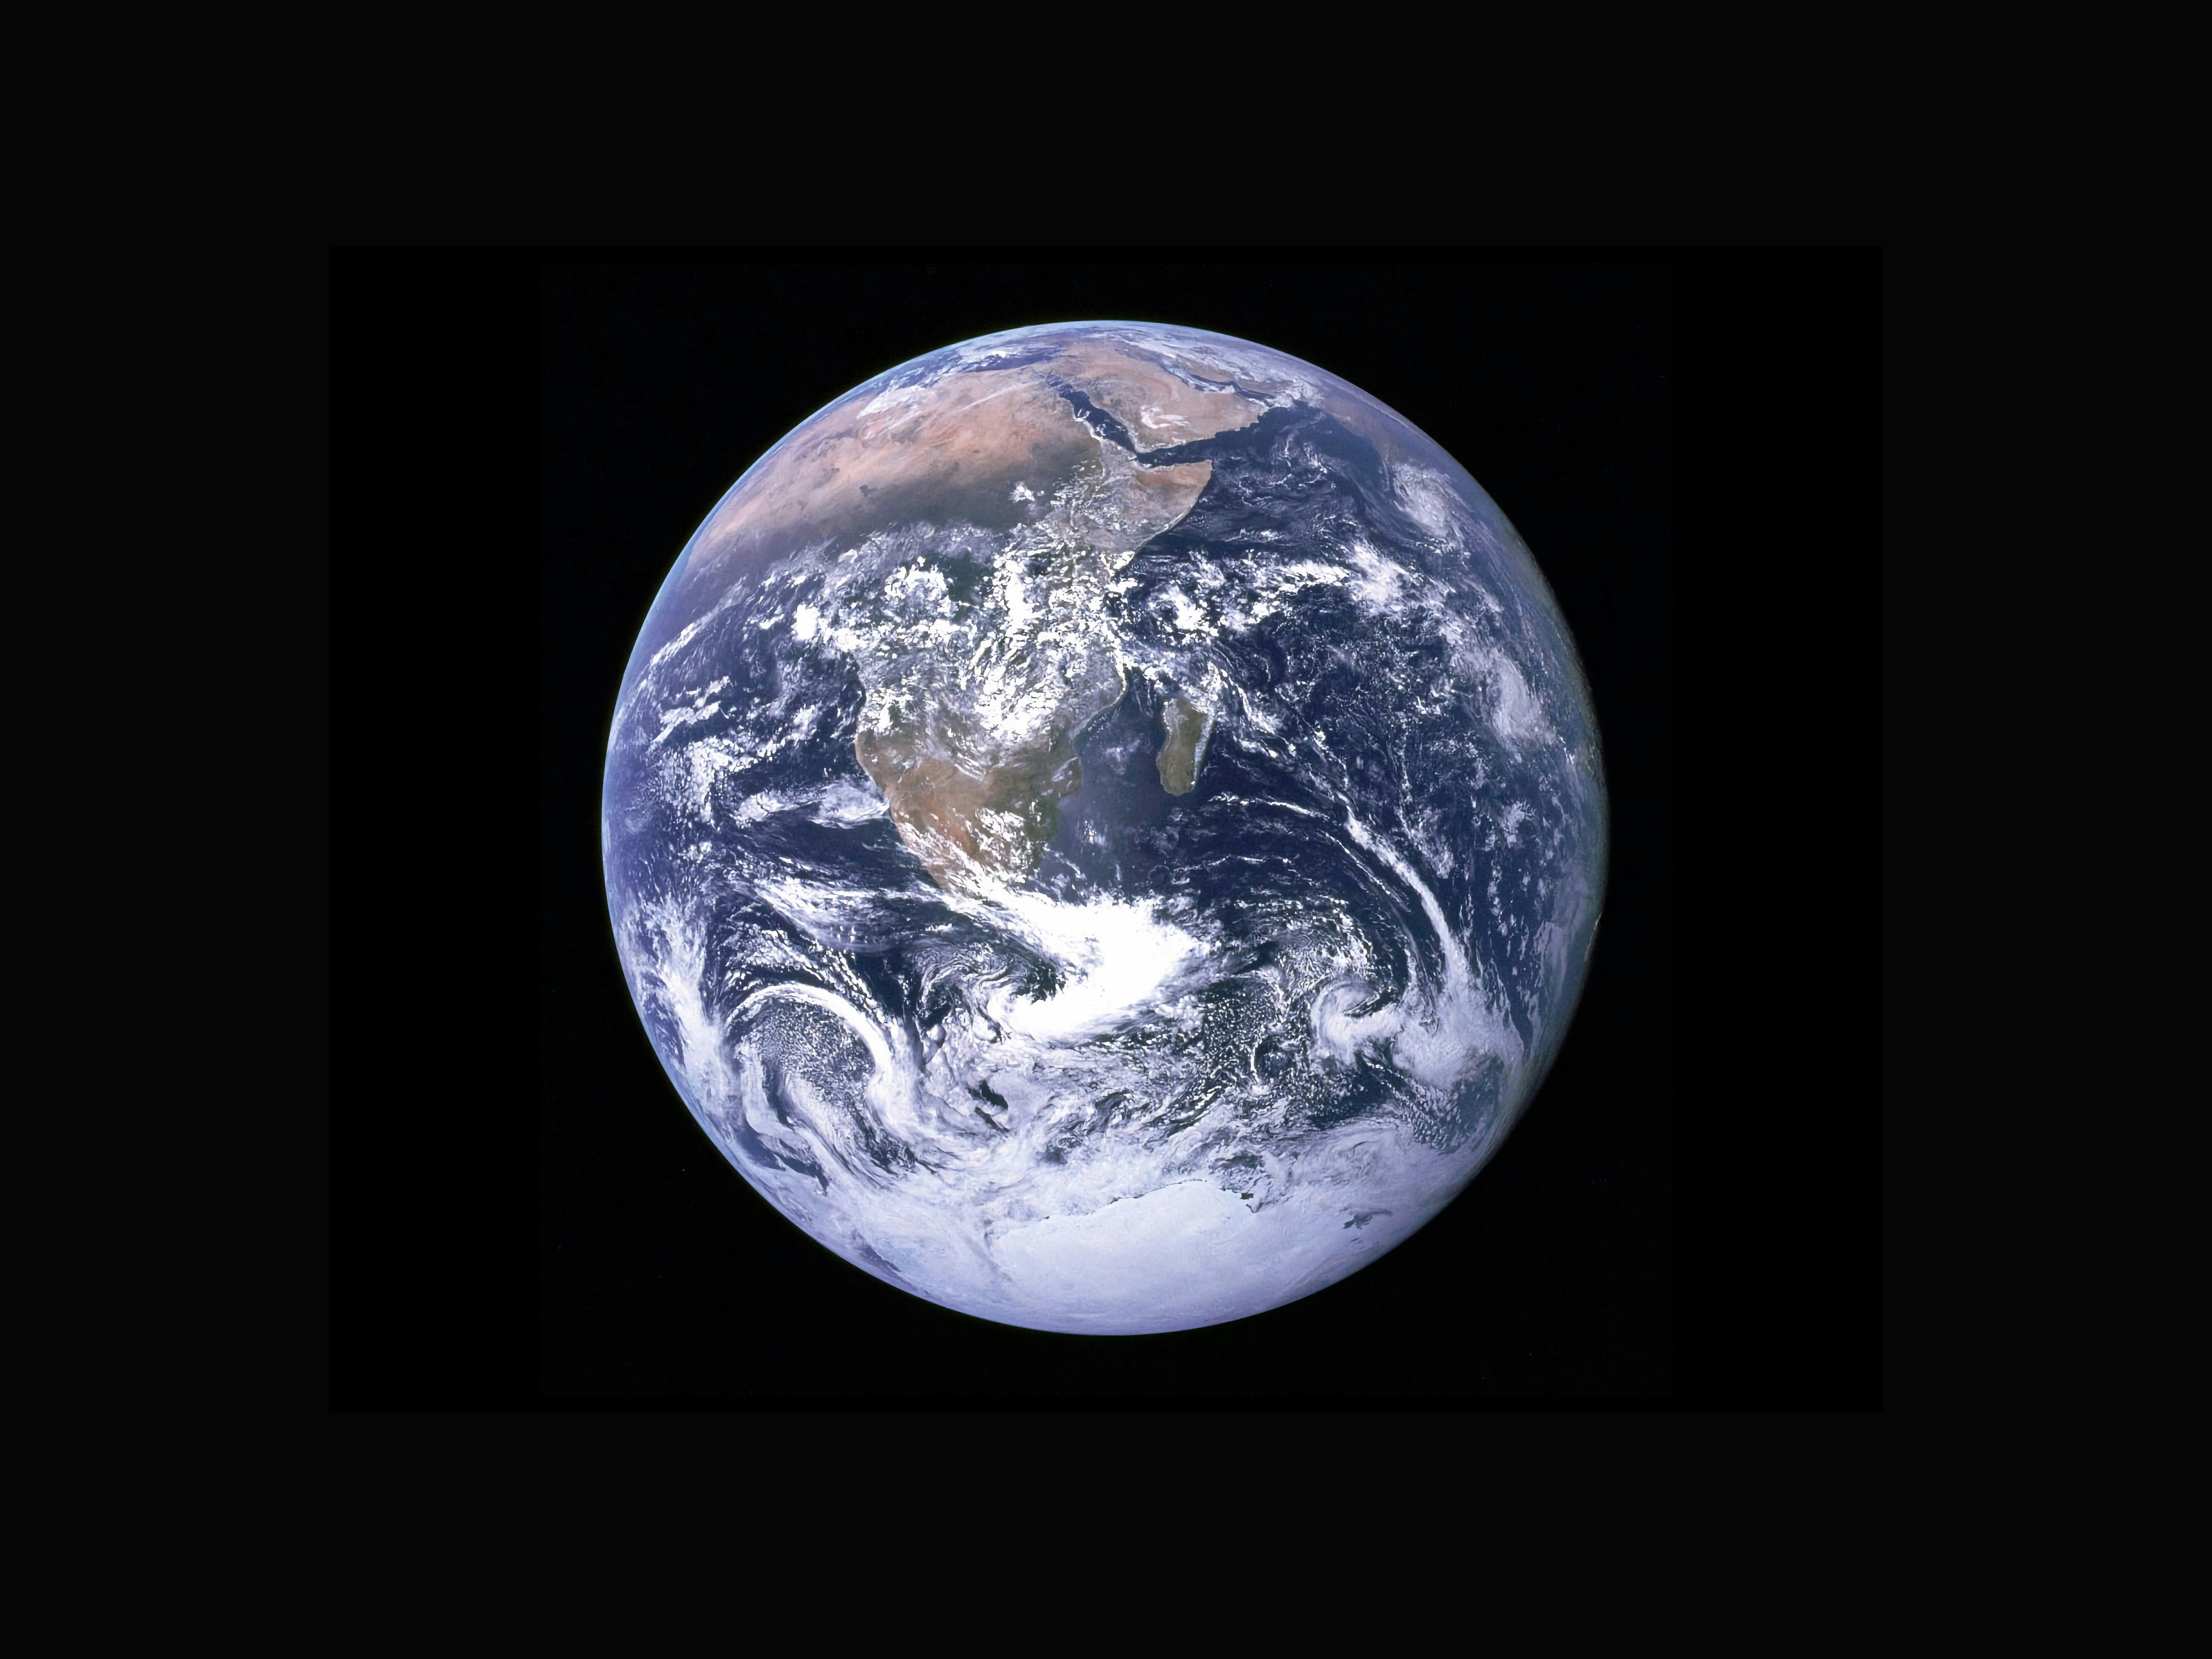
Image: Unsplash/Lothar Hoefle
Stay up to date:
Climate Indicators
Listen to the article
- Since 1992, the global average sea level has risen more than 10cm, NASA says.
- Over the last 30 years, human-caused sea level rise is 10 times that of natural sea level rise.
- The sea is also rising faster – with the global average rise speeding up from 2.5mm a year in the early 1990s to 3.9mm a year over the last decade.
Sea levels are rising higher and faster because human activity is having a “huge” impact on Earth’s climate, NASA says.
After 30 years studying rising and falling seas with its TOPEX/Poseidon satellite, the United States’ space agency says it now has data equivalent to the work of “half a million tide gauges.”
The information gathered is also “long enough and sensitive enough” to detect sea level changes that are outside natural cycles in a season, year or decade.
What's the World Economic Forum doing about the ocean?
Sea levels are rising
Since 1992, when the satellite started recording ocean surface height around the world, the global average sea level – shown by the zigzagging line in these charts – has risen 10.1cm, NASA says.
The red and deep orange colours on the plot line indicate some parts of the ocean rising faster than the global rate.
Tracking back even further, satellites and tide gauges from the past 140 years show a rise in the global sea level of between 21cm to 24cm.

Human activity is fuelling sea level rise
NASA concludes that sea level rise over this 30-year period is about 10 times more than it would be if only natural flows of water between ocean and land were measured in a year.
For example, about 1cm of sea level rise and fall a year is caused by winter rain and snow in the northern hemisphere, with water moving from ocean to land, and then running off back into the oceans. Sea levels can also be affected by years with El Niño or La Niña climate patterns, which warm and cool areas of the Pacific Ocean.
NASA oceanographer Josh Willis said the 30 years of data finally shows “what a huge impact we have on the Earth’s climate”.
“The rise of sea level caused by human interference with the climate now dwarfs the natural cycles,” he added. “And it is happening faster and faster every decade.”

Sea levels are rising faster
The speed of sea level rise is also accelerating. Global average sea level rise averaged about 1.5mm a year during the 20th century. By the early 1990s, this had accelerated to about 2.5mm a year. The speed of sea level rise has quickened again over the last decade to 3.9mm a year.
Every 2.5cm of sea level rise equates to 2.5m of beachfront lost along the average coast, NASA says.
Accept our marketing cookies to access this content.
These cookies are currently disabled in your browser.
Sea levels rise as the world warms
Climate change is driving sea levels higher, scientists say. Global warming caused by emissions of greenhouse gases like carbon dioxide is accelerating the melting of ice sheets and glaciers. Seawater also expands as it warms.
Sea levels could be as much as 1.1m higher by the end of this century, forecasts the Intergovernmental Panel on Climate Change, a UN climate science body with 195 member countries that assesses the risks and impacts of climate change.
Between 200 million and 630 million people by the year 2100 could be impacted by rising sea levels and flooding, research suggests. Mass migration could follow, with river flooding alone potentially forcing up to 50 million people a year to leave their homes by the end of the next century, one study predicts.
Reducing emissions, building flood defences, taking steps to protect people and property, and investing in natural assets that absorb CO2 – like forests and grasslands – can help countries protect themselves against rising sea levels, the World Economic Forum says.
Accept our marketing cookies to access this content.
These cookies are currently disabled in your browser.
Don't miss any update on this topic
Create a free account and access your personalized content collection with our latest publications and analyses.
License and Republishing
World Economic Forum articles may be republished in accordance with the Creative Commons Attribution-NonCommercial-NoDerivatives 4.0 International Public License, and in accordance with our Terms of Use.
The views expressed in this article are those of the author alone and not the World Economic Forum.
Forum Stories newsletter
Bringing you weekly curated insights and analysis on the global issues that matter.
More on Climate ActionSee all
Elizabeth Mills
April 17, 2025
Tom Crowfoot
April 17, 2025
Will Hicks and Louise Thomas
April 16, 2025
Lindsey Ricker and Hanh Nguyen
April 16, 2025
Gill Einhorn
April 15, 2025
Hubert Keller and Maximilian Martin
April 15, 2025


