How big a problem is wealth inequality in the US?

There is no dispute that income inequality has been on the rise in the US for the past four decades. The share of total income earned by the top 1% of families was less than 10% in the late 1970s, but now exceeds 20% as of the end of 2012 (Piketty and Saez 2003). A large portion of this increase is due to an upsurge in the labour incomes earned by senior company executives and successful entrepreneurs. But is the rise in US economic inequality purely a matter of rising labour compensation at the top, or did wealth inequality rise as well?
Before we answer that question (hint: the answer is a definitive yes, as we will demonstrate below) we need to define what we mean by wealth. Wealth is the stock of all the assets people own, including their homes, pension saving and bank accounts, minus all debts. Wealth can be self-made out of work and saving, but it can also be inherited.
Unfortunately, there is much less data available on wealth in the US than there is on income. Income tax data exists since 1913 – the first year the country collected federal income tax – but there is no comparable tax on wealth to provide information on the distribution of assets. Currently available measures of wealth inequality rely either on surveys (the Survey of Consumer Finances of the Federal Reserve Board), on estate tax return data (Kopczuk and Saez 2004), or on lists of wealthy individuals, such as the Forbes 400 list of wealthiest Americans.
In our new working paper (Saez and Zucman 2014), we try to measure wealth in another way. We use comprehensive data on capital income – such as dividends, interest, rents and business profits – that is reported on individual income tax returns since 1913. We then capitalize this income so that it matches the amount of wealth recorded in the Federal Reserve’s Flow of Funds, the national balance sheets that measure aggregate wealth of US families. In this way we obtain annual estimates of US wealth inequality stretching back a century.
Wealth inequality, it turns out, has followed a spectacular U-shaped evolution over the past 100 years. From the Great Depression in the 1930s through the late 1970s there was a substantial democratization of wealth. The trend then inverted, with the share of total household wealth owned by the top 0.1% increasing to 22% in 2012 from 7% in the late 1970s (see Figure 1). The top 0.1% includes 160,000 families with total net assets of more than $20 million in 2012.
Figure 1. The return of the Roaring Twenties
Notes: The figure plots wealth share owned by the top .1% richest families in the US from 1913 to 2012. Wealth is total assets (including real estate and funded pension wealth) net of all debts. Wealth excludes the present value of future government transfers (such as Social Security or Medicare benefits).
Source: Saez and Zucman (2014).
Figure 1 shows that wealth inequality has exploded in the US over the past four decades. The share of wealth held by the top 0.1% of families is now almost as high as in the late 1920s, when The Great Gatsby defined an era that rested on the inherited fortunes of the robber barons of the Gilded Age.
In recent decades, only a tiny fraction of the population saw its wealth share grow. While the wealth share of the top 0.1% increased a lot in recent decades, that of the next 0.9% (families between the top 1% and the top 0.1%) did not. And the share of total wealth of the “merely rich” – families who fall in the top 10% but are not wealthy enough to be counted among the top 1% – actually decreased slightly over the past four decades. In other words, family fortunes of $20 million or more grew much faster than those of only a few millions.
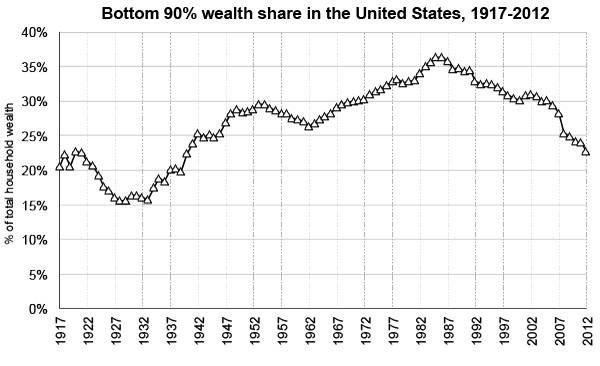
The flip side of these trends at the top of the wealth ladder is the erosion of wealth among the middle class and the poor. There is a widespread public view across American society that a key structural change in the US economy since the 1920s is the rise of middle-class wealth, in particular because of the development of pensions and the rise in home ownership rates. But our results show that while the share of wealth of the bottom 90% of families did gradually increase from 15% in the 1920s to a peak of 36% in the mid-1980s, it then dramatically declined. By 2012, the bottom 90% collectively owns only 23% of total US wealth, about as much as in 1940 (see Figure 2).
Figure 2. The rise and fall of middle-class wealth
Notes: The figure plots wealth share owned by the bottom 90% poorest families in the US from 1917 to 2012. Wealth is total assets (including real estate and funded pension wealth) net of all debts. Wealth excludes the present value of future government transfers (such as Social Security or Medicare benefits).
Source: Saez and Zucman (2014).
The growing indebtedness of most Americans is the main reason behind the erosion of the wealth share of the bottom 90% of families. Many middle-class families own homes and have pensions, but too many of these families also have much higher mortgages to repay and much higher consumer credit and student loans to service than before (Mian and Sufi 2014). For a time, rising indebtedness was compensated by the increase in the market value of the assets of middle-class families. The average wealth of bottom 90% of families jumped during the stock-market bubble of the late 1990s and the housing bubble of the early 2000s. But it then collapsed during and after the Great Recession of 2007–2009 (see Figure 3).
Figure 3. The new wealth divide in the US
Notes: The figure depicts the average real wealth of bottom 90% of families (right y-axis) and top 1% families (left y-axis) from 1946 to 2012. The scales differ by a factor 100 to reflect the fact that top 1% of families are 100 times richer than the bottom 90% of families. Wealth is expressed in constant 2010 US dollars, using the GDP deflator.
Source: Saez and Zucman (2014).
Since the housing and financial crises of the late 2000s there has been no recovery in the wealth of the middle class and the poor. The average wealth of the bottom 90% of families is equal to $80,000 in 2012 – the same level as in 1986. In contrast, the average wealth for the top 1% more than tripled between 1980 and 2012. In 2012, the wealth of the top 1% increased almost back to its peak level of 2007. The Great Recession looks only like a small bump along an upward trajectory.
How can we explain the growing disparity in American wealth? The answer is that the combination of higher income inequality alongside a growing disparity in the ability to save for most Americans is fuelling the explosion in wealth inequality. For the bottom 90% of families, real wage gains (after factoring in inflation) were very limited over the past three decades, but for their counterparts in the top 1% real wages grew fast. In addition, the saving rate of middle-class and lower-class families collapsed over the same period while it remained substantial at the top. Today, the top 1% families save about 35% of their income, while the bottom 90% families save about zero (Saez and Zucman 2014).
The implications of rising wealth inequality and possible remedies
If income inequality stays high and if the saving rate of the bottom 90% of families remains low then wealth disparity will keep increasing. Ten or 20 years from now, all the gains in wealth democratization achieved during the New Deal and the post-war decades could be lost. While the rich would be extremely rich, ordinary families would own next to nothing, with debts almost as high as their assets. Paris School of Economics professor Thomas Piketty warns that inherited wealth could become the defining line between the haves and the have-nots in the 21st century (Piketty 2014). This provocative prediction hit a nerve in the US this year when Piketty’s book Capital in the 21st Century became a national best seller because it outlined a direct threat to the cherished American ideals of meritocracy and opportunity.
What should be done to avoid this dystopian future? We need policies that reduce the concentration of wealth, prevent the transformation of self-made wealth into inherited fortunes and encourage savings among the middle class. First, current preferential tax rates on capital income compared to wage income are hard to defend in light of the rise of wealth inequality and the very high savings rate of the wealthy. Second, estate taxation is the most direct tool to prevent self-made fortunes from becoming inherited wealth – the least justifiable form of inequality in the American meritocratic ideal. Progressive estate and income taxation were the key tools that reduced the concentration of wealth after the Great Depression (Piketty and Saez 2003, Kopczuk and Saez 2004). The same proven tools are needed again today.
There are a number of specific policy reforms needed to rebuild middle-class wealth. A combination of prudent financial regulation to rein in predatory lending, incentives to help people save – nudges have been shown to be very effective in the case of 401(k) pensions (Thaler and Sunstein 2008) – and more generally steps to boost the wages of the bottom 90% of workers are needed so that ordinary families can afford to save.
One final reform also needs to be on the policymaking agenda – the collection of better data on wealth in the US. Despite our best efforts to build wealth inequality data, we want to stress that the US is lagging behind in terms of the quality of its wealth and saving data. It would be relatively easy for the US Treasury to collect more information – in particular balances on 401(k) and bank accounts – on top of what it already collects to administer the federal income tax. This information could help enforce the collection of current taxes more effectively and would be invaluable for obtaining more precise estimates of the joint distributions of income, wealth, saving and consumption. Such information is needed to illuminate the public debate on economic inequality. It is also required to evaluate and implement alternative forms of taxation, such as progressive wealth or consumption taxes, in order to achieve broad-based and sustainable economic growth.
Published in collaboration with VoxEU
Authors: Emmanuel Saez is Professor of Economics and Director of the Center for Equitable Growth at the University of California Berkeley. Gabriel Zucman is an assistant professor of economics at the London School of Economics.
Image: A man stands on Hollywood Boulevard as the sun rises near the site of the 84th Academy Awards in Hollywood, California February 23, 2012. REUTERS/Lucy Nicholson
Don't miss any update on this topic
Create a free account and access your personalized content collection with our latest publications and analyses.
License and Republishing
World Economic Forum articles may be republished in accordance with the Creative Commons Attribution-NonCommercial-NoDerivatives 4.0 International Public License, and in accordance with our Terms of Use.
The views expressed in this article are those of the author alone and not the World Economic Forum.
Stay up to date:
Hyperconnectivity
Related topics:
Forum Stories newsletter
Bringing you weekly curated insights and analysis on the global issues that matter.
More on Financial and Monetary SystemsSee all
Jaime Magyera
November 13, 2025


