5 charts that show what will happen in 2016

Where next? ... From global GDP to women's pay, these charts point the way
Image: REUTERS/Kim Kyung-Hoon
Stay up to date:
Gender Inequality
No one can predict the future. But as our global stockpile of graphs and data grows, we're getting better at hazarding guesses. So, from soaring global temperatures to plunging poverty, that's exactly what we'll attempt. Here are five charts that tell us what we can expect in the coming year.
The world economy will grow – slowly
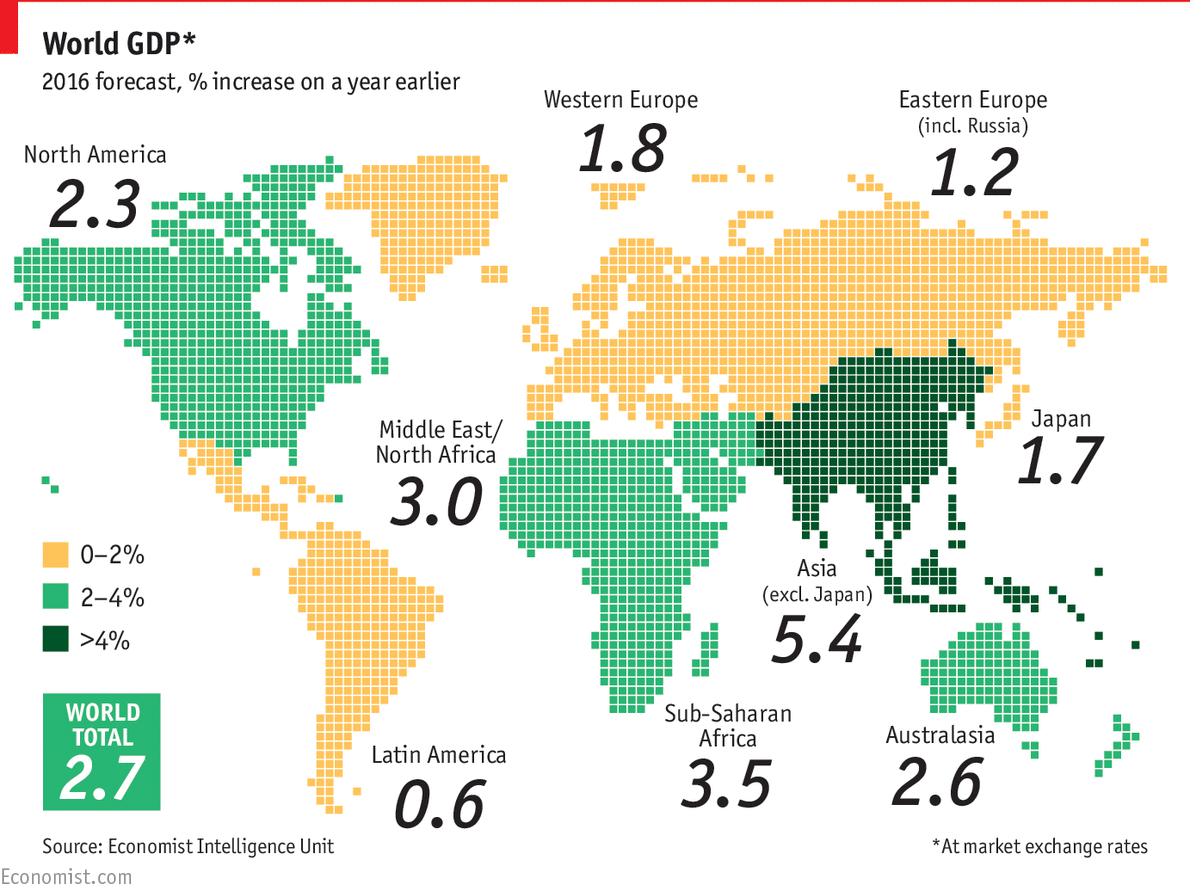
Global GDP is expected to rise in 2016, but only by 2.7%, according to The Economist. Forecasts have recently dropped due to intensifying debt levels in emerging markets and financial contractions in Brazil and Russia. There has also been weaker output in most of the world’s biggest economies, including the United States and China. This chart shows the expected growth by region for the coming year.

Extreme weather will hit food production
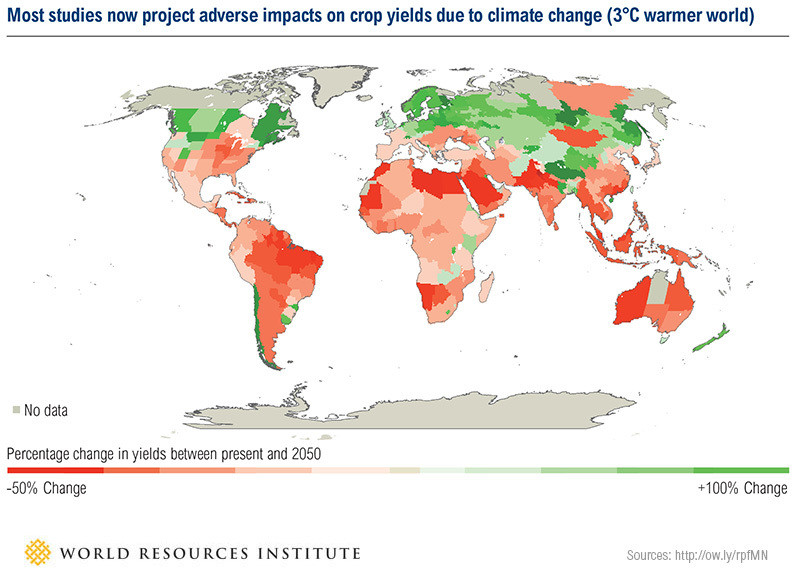
About 25% of all damage caused by natural disasters happens in the agriculture sector, according to the UN’s Food & Agriculture Organization. And the sector is about to be further troubled by El Nino, the weather phenomenon currently pushing up surface temperatures in the tropical Pacific. So what does increasing heat mean for global food production in 2016? This map shows how desertification will affect crop yields and livestock around the world between now and 2050.

Women will still earn less than men
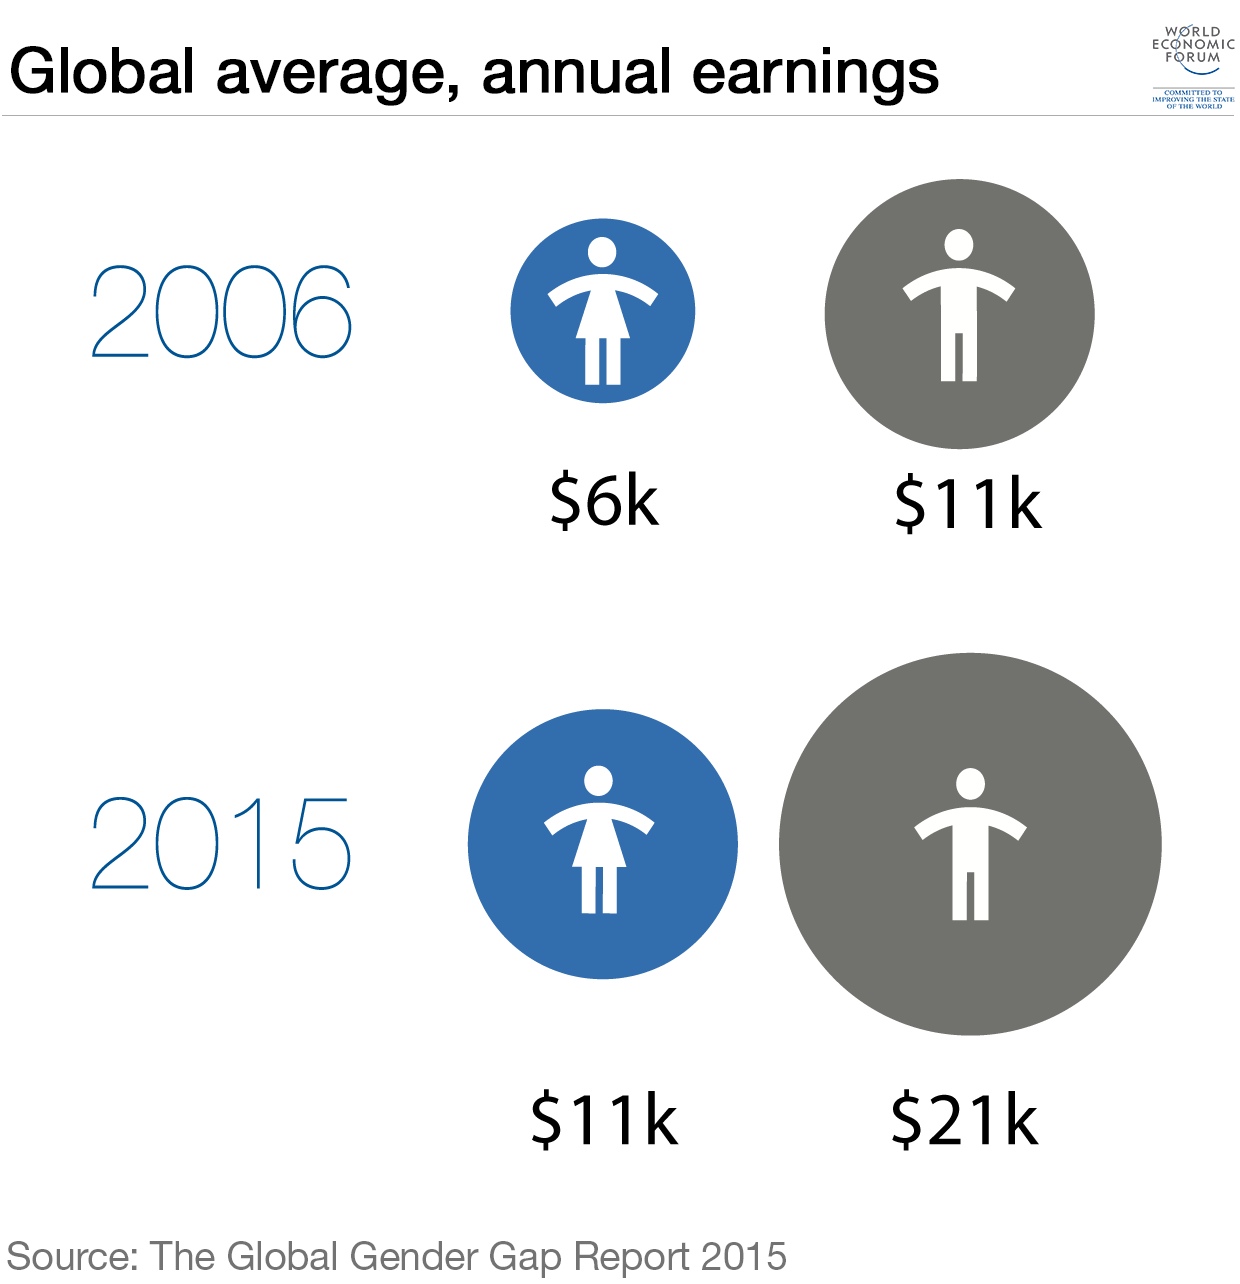
The World Economic Forum’s Global Gender Gap Report 2015 states that the economic gap between men and women globally will not close before 2133. This chart shows that despite a steady increase in women’s wages, their current worldwide average only equals what men were earning 10 years ago. It also shows that while the year 2016 is likely to see a continued rise in women’s wages, growth will be slow – twice as slow as men’s wages.

Poverty levels will keep plunging
The number of people living in extreme poverty has fallen dramatically over the past two decades, from 1.9 billion to 836 million, with most of that reduction taking place after the year 2000. There are fewer hungry people, too: in the early 1990s, 23.3% was going hungry; while between the years 2014 and 2016, the proportion is expected to dip to 12.9%. The list below shows how much poverty levels are expected to have fallen by the beginning of 2016, with sub-Saharan Africa forecast to see the most dramatic improvement.

The world will heat up – fast
Our current global target of 2C is too optimistic, according to the latest scientific research. No fewer than five meteorological institutions have released their predictions as to how much the world will heat up before 2030 if our current efforts to curb greenhouse gas emissions continue. The numbers range between 2.7C and as much as 3.7C, leaving our previous ambition of 2C in the dust. It gets worse: according to the UN, if we don't act now on global warming, temperatures could rise by as much as 4.8C.

Have you read?
Where are food supplies most at risk from climate change?
How can we help farmers adapt to a warmer world
This chart shows global warming is speeding up
Author: Anna Bruce-Lockhart is an editor at the World Economic Forum
Image: REUTERS/Kim Kyung-Hoon
Don't miss any update on this topic
Create a free account and access your personalized content collection with our latest publications and analyses.
License and Republishing
World Economic Forum articles may be republished in accordance with the Creative Commons Attribution-NonCommercial-NoDerivatives 4.0 International Public License, and in accordance with our Terms of Use.
The views expressed in this article are those of the author alone and not the World Economic Forum.
Related topics:
Forum Stories newsletter
Bringing you weekly curated insights and analysis on the global issues that matter.
More on Economic GrowthSee all
John Letzing
July 3, 2025
Madeleine North
July 3, 2025
Erik Crouch
July 1, 2025
Stephanie Holmes, Pooja Chhabria and John Letzing
June 26, 2025
Chris Hamill-Stewart
June 25, 2025


