These maps explore modern American in ways you might not have considered before

22 maps that explain various economic, social, demographic, and linguistic aspects of the United States of America.
Image: REUTERS/Robert Galbraith
Stay up to date:
United States
At Business Insider, we love maps. There is no better way to convey data about people and places than with a map.
To that end, we've put together 22 maps that explain various economic, social, demographic, and linguistic aspects of the United States of America. Check them out.
Rob Wile contributed to an earlier version of this post.
This map shows jobs that are held at a much higher rate in each state than in the country as a whole.

And here are jobs that pay much more in a state than they do in the country as a whole.

America's population is always dynamic. This map shows overall population change between 2014 and 2015, and the next few maps show the various components of that change.

Counties in oil-heavy regions and the west saw many more people born than dying, while Appalachian and northern counties had the opposite.

Coastal cities like San Francisco, New York, and Miami all had a lot of immigration from other countries.

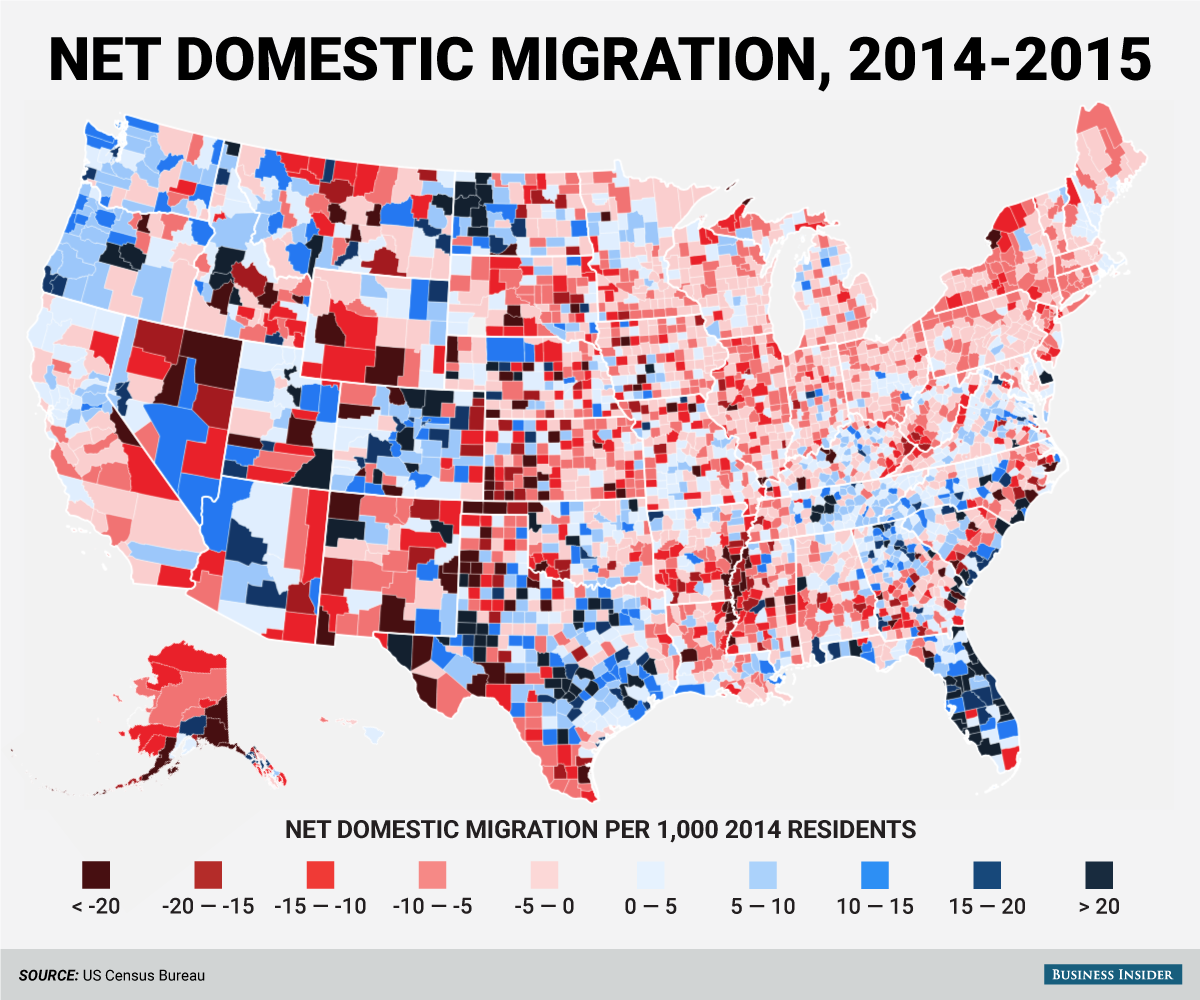
Counties in the northeast saw more people move out than move in, while the south, especially Texas and Florida, had a major influx of domestic movers.
Here were the most popular names for baby boys in 2015 in every state. William was quite popular in the southeast while Noah cleaned up in the southwest.

And here are the girls' names. Emma dominated the middle of the country.

Educational inequality still exists in the US. Large parts of the south still have relatively low high school graduation rates.

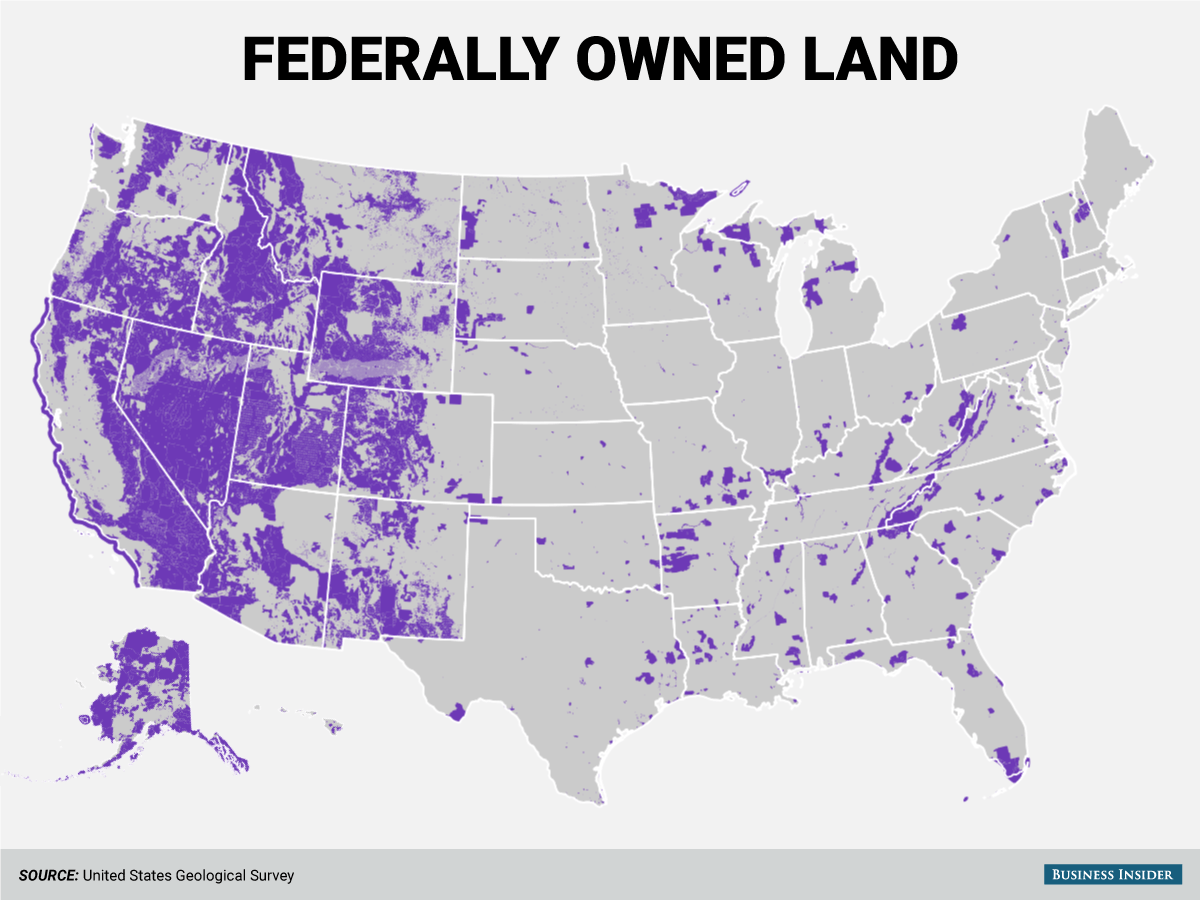
The US government owns a bunch of land out West. Purple dots represent federally owned land.
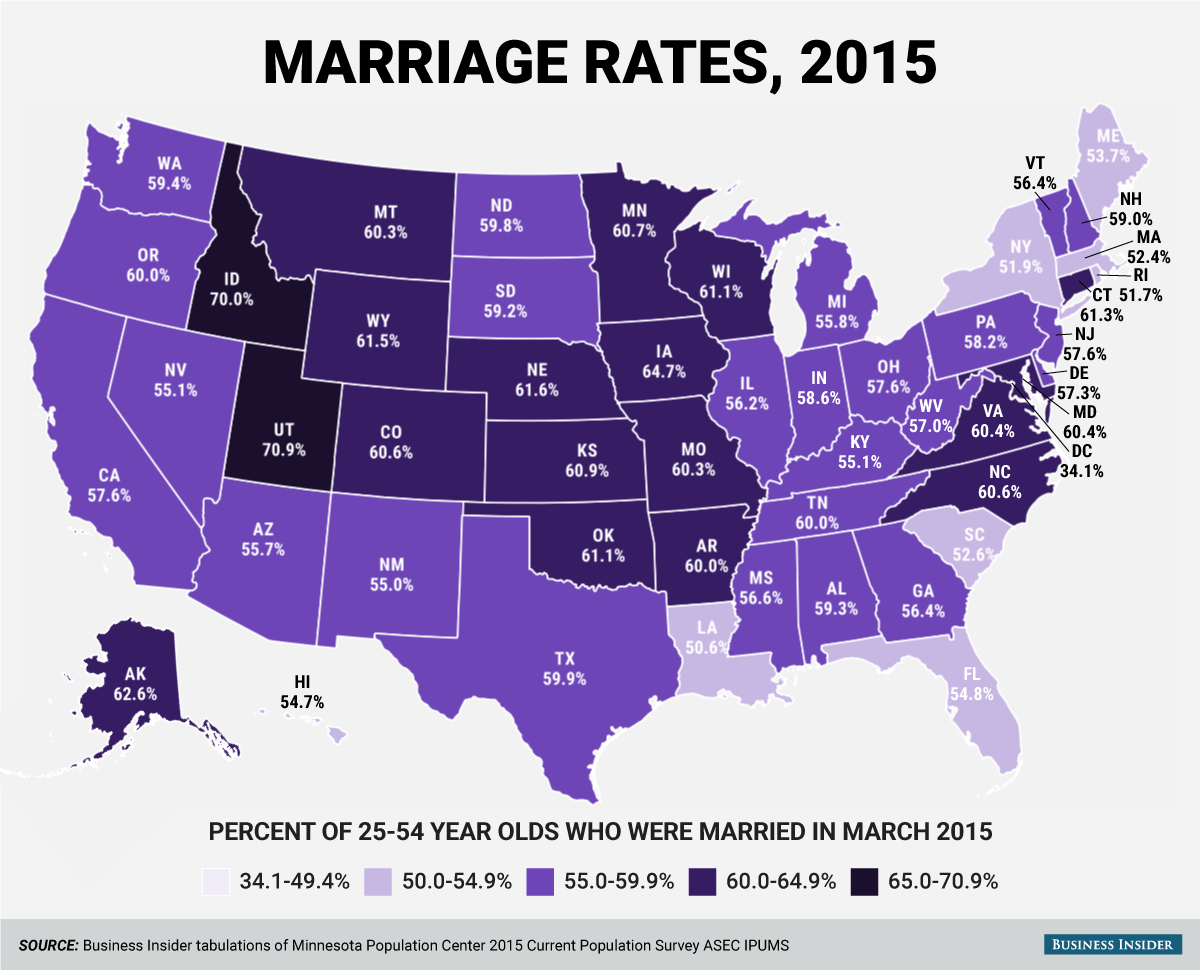
Marriage is much more common in the heartland than in the northeast and a few other states.
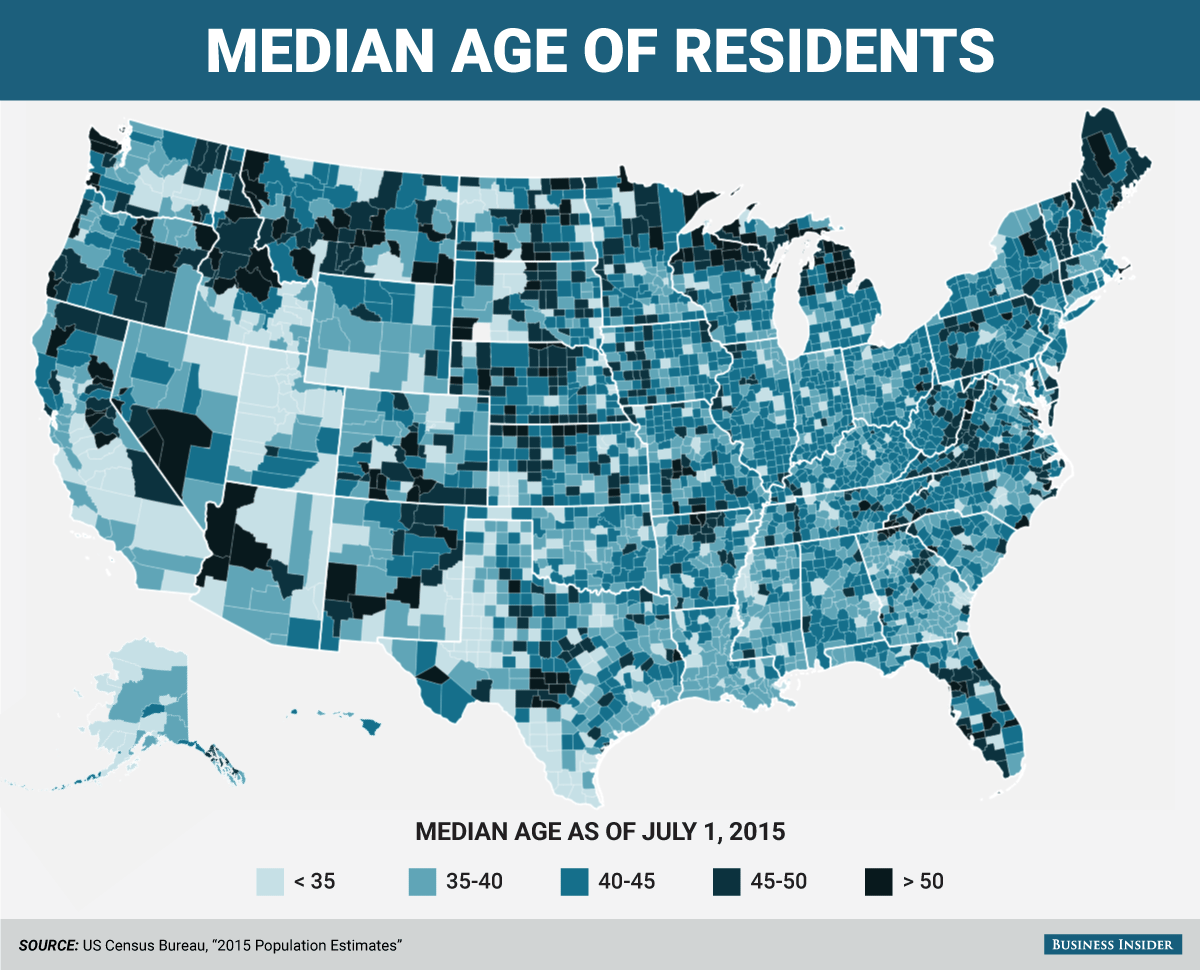
Age varies among the nation's counties. Northern areas tend to be older, while southern and western counties have lower median ages.
Large publicly traded companies have their headquarters scattered among the states.

The US economy is so large that the GDP of individual states is often comparable to entire other countries.

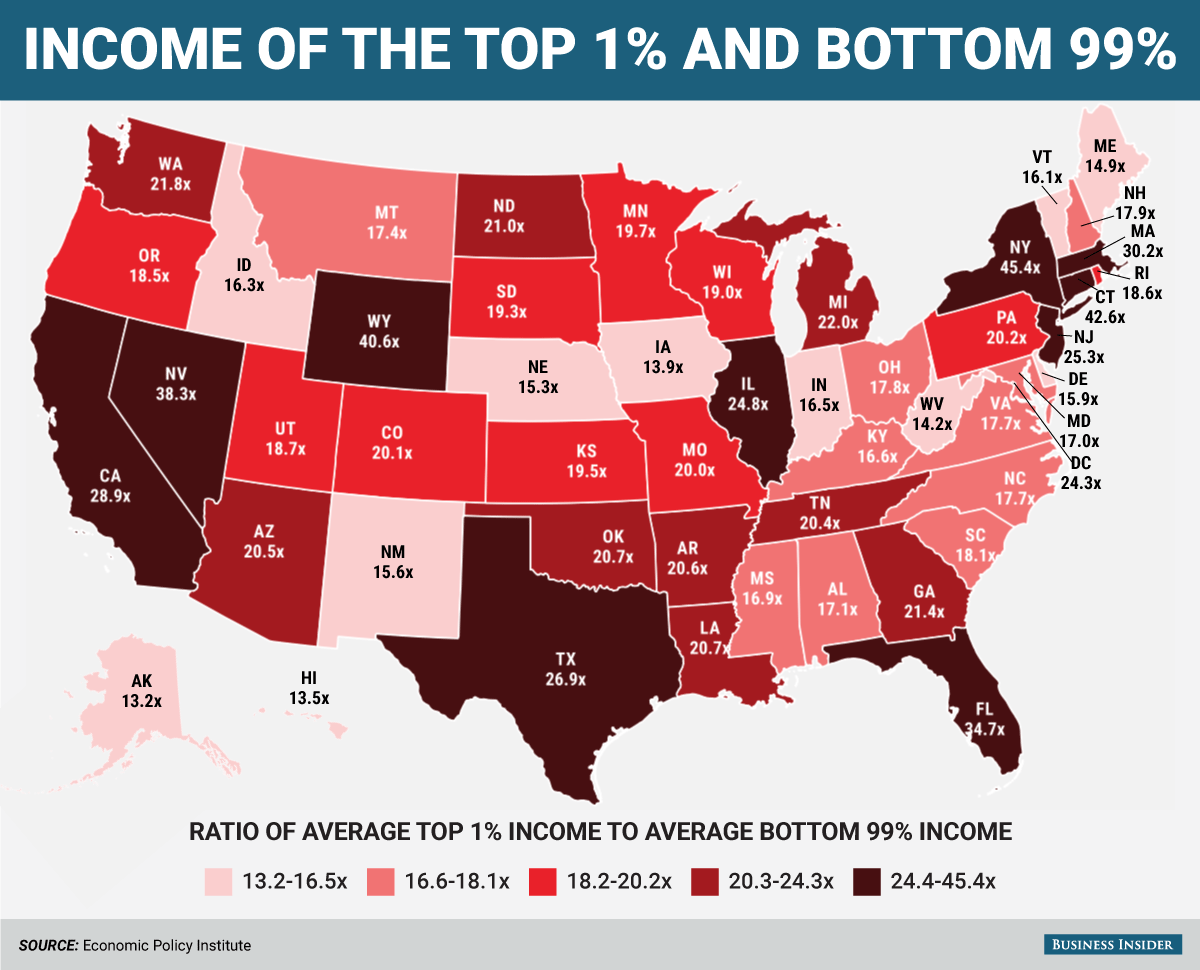
Income inequality varies widely among the states.
And income for millennials also widely varies.

While the pay gap between men and women affects Americans across the country, that gap is worse in some states than others.
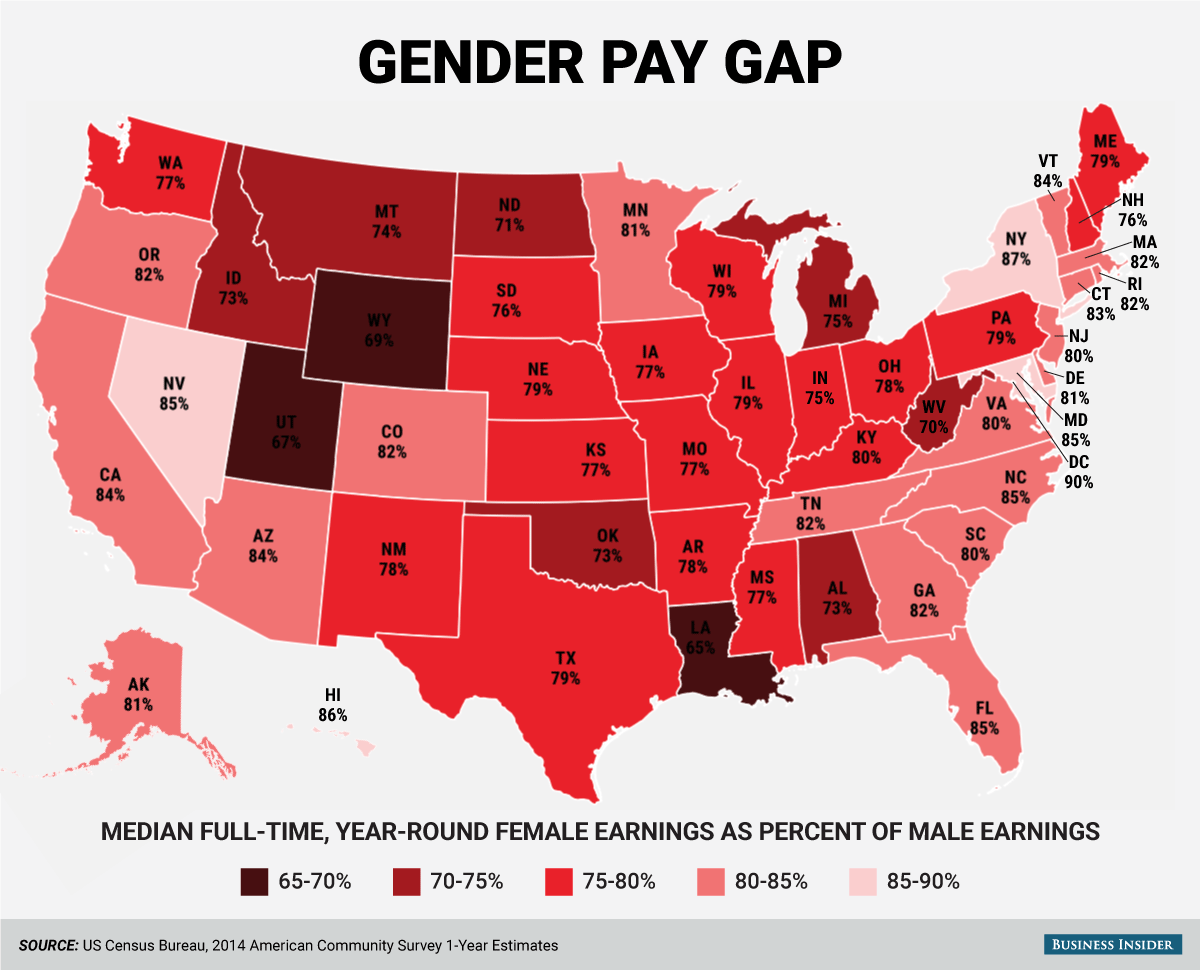
Business Insider/Andy Kiersz, data from US Census Bureau
The cost of living varies widely across the US, with big coastal cities much more expensive than inland and more rural areas.

Here's the country that each state exports the most goods to.
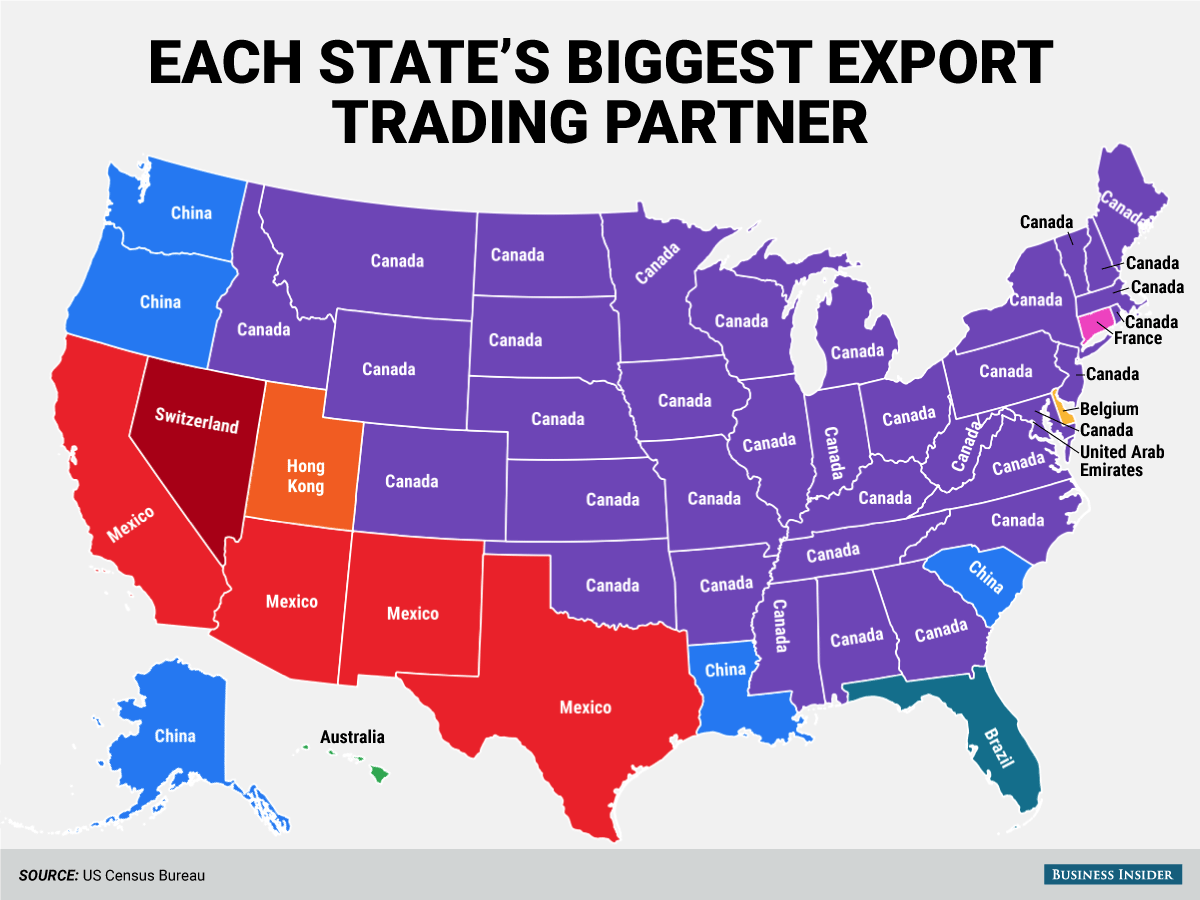
Business Insider/Andy Kiersz, data from US Census Bureau
And the country each state imports the most goods from.
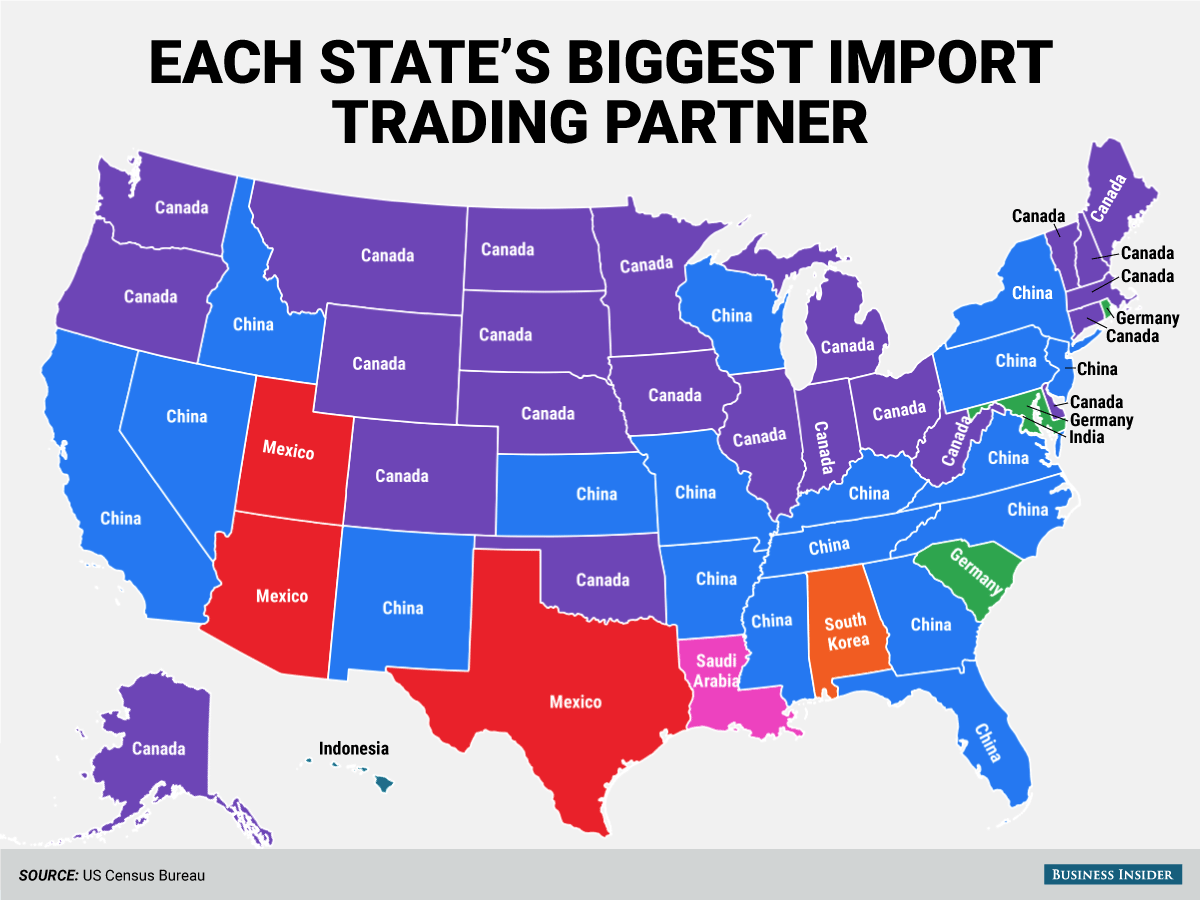
Business Insider/Andy Kiersz, data from US Census Bureau
Half of the US population lives in a handful of super-dense counties.

Business Insider/Andy Kiersz, data from US Census Bureau
New York is one of the world's most cosmopolitan cities. Here's the most commonly spoken language in each NYC neighborhood aside from English or Spanish.

Don't miss any update on this topic
Create a free account and access your personalized content collection with our latest publications and analyses.
License and Republishing
World Economic Forum articles may be republished in accordance with the Creative Commons Attribution-NonCommercial-NoDerivatives 4.0 International Public License, and in accordance with our Terms of Use.
The views expressed in this article are those of the author alone and not the World Economic Forum.
Forum Stories newsletter
Bringing you weekly curated insights and analysis on the global issues that matter.
More on Economic GrowthSee all
Khalid Alaamer
April 22, 2025
Jai Shroff
April 22, 2025
Samir Saran and Anirban Sarma
April 17, 2025
Lucia Fry and Naomi Nyamweya
April 17, 2025
Nada AlSaeed
April 16, 2025


