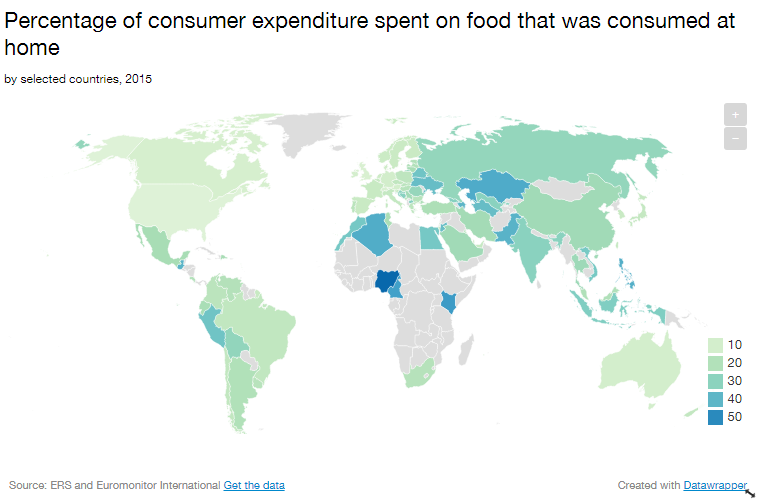
Which countries spend the most on food? This map will show you

The more developed a country is, the smaller the percentage of household income it spends on food.
Image: REUTERS/Franciszek Mazur/Agencja Gazeta
Stay up to date:
Agriculture, Food and Beverage
Americans spend just 6.4% of their household income on food. That’s according to the latest figures compiled by the US Department of Agriculture (USDA). Generally speaking, the more developed a country is, the smaller the percentage of household income it spends on food, as this map shows.

There are only eight countries in the world that spend less than 10% of their household income on food. Four of these are in Europe: the UK is third at 8.2%, followed by Switzerland at 8.7%; Ireland spends 9.6% and Austria 9.9%.
The remaining four countries are spread across the globe. The US spends the least at 6.4%, Singapore spends the second lowest amount at 6.7%. Canada spends 9.1% on food, while Australia spends 9.8%.

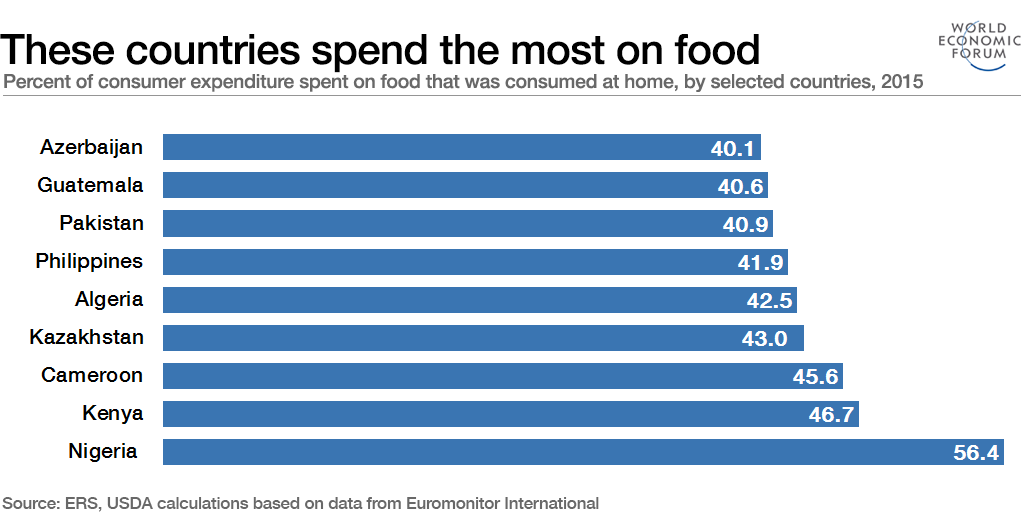
Nigeria spends over half of household income on food, and there are nine other countries that spend over 40% on food.
Four of them are in Africa: Nigeria 56.4%; Kenya 46.7%; Cameroon 45.6%; and Algeria 42.5%. Four are in Asia: Kazakhstan 43.0%; Philippines 41.9%; Pakistan 40.9%; and Azerbaijan 40.1%. Guatemala is the only South American country to appear in the list and spends 40.6% of its household income on food.

The figures do not mean that food is more expensive in Nigeria than in the US. In fact, quite the reverse. The average American spends $2,392 per year on food, the average Nigerian half that: $1,132. The average Kenyan spends just $543 a year on food.
However, there can be wide disparities within a country.
Over the past 25 years, the poorest 20% of households in the US spent between 28.8% and 42.6% on food, compared with 6.5% to 9.2% spent by the wealthiest 20% of households.
Accept our marketing cookies to access this content.
These cookies are currently disabled in your browser.
Don't miss any update on this topic
Create a free account and access your personalized content collection with our latest publications and analyses.
License and Republishing
World Economic Forum articles may be republished in accordance with the Creative Commons Attribution-NonCommercial-NoDerivatives 4.0 International Public License, and in accordance with our Terms of Use.
The views expressed in this article are those of the author alone and not the World Economic Forum.
Related topics:
Forum Stories newsletter
Bringing you weekly curated insights and analysis on the global issues that matter.
More on Food and WaterSee all
Tom Crowfoot
July 8, 2025
Duncan Wood
July 8, 2025
Naoko Tochibayashi and Mizuho Ota
July 8, 2025
Pepe Puchol-Salort and Nicole Cowell
June 30, 2025
Chiara Cecchini
June 25, 2025


