6 charts that show the state of biodiversity and nature loss - and how we can go 'nature positive'

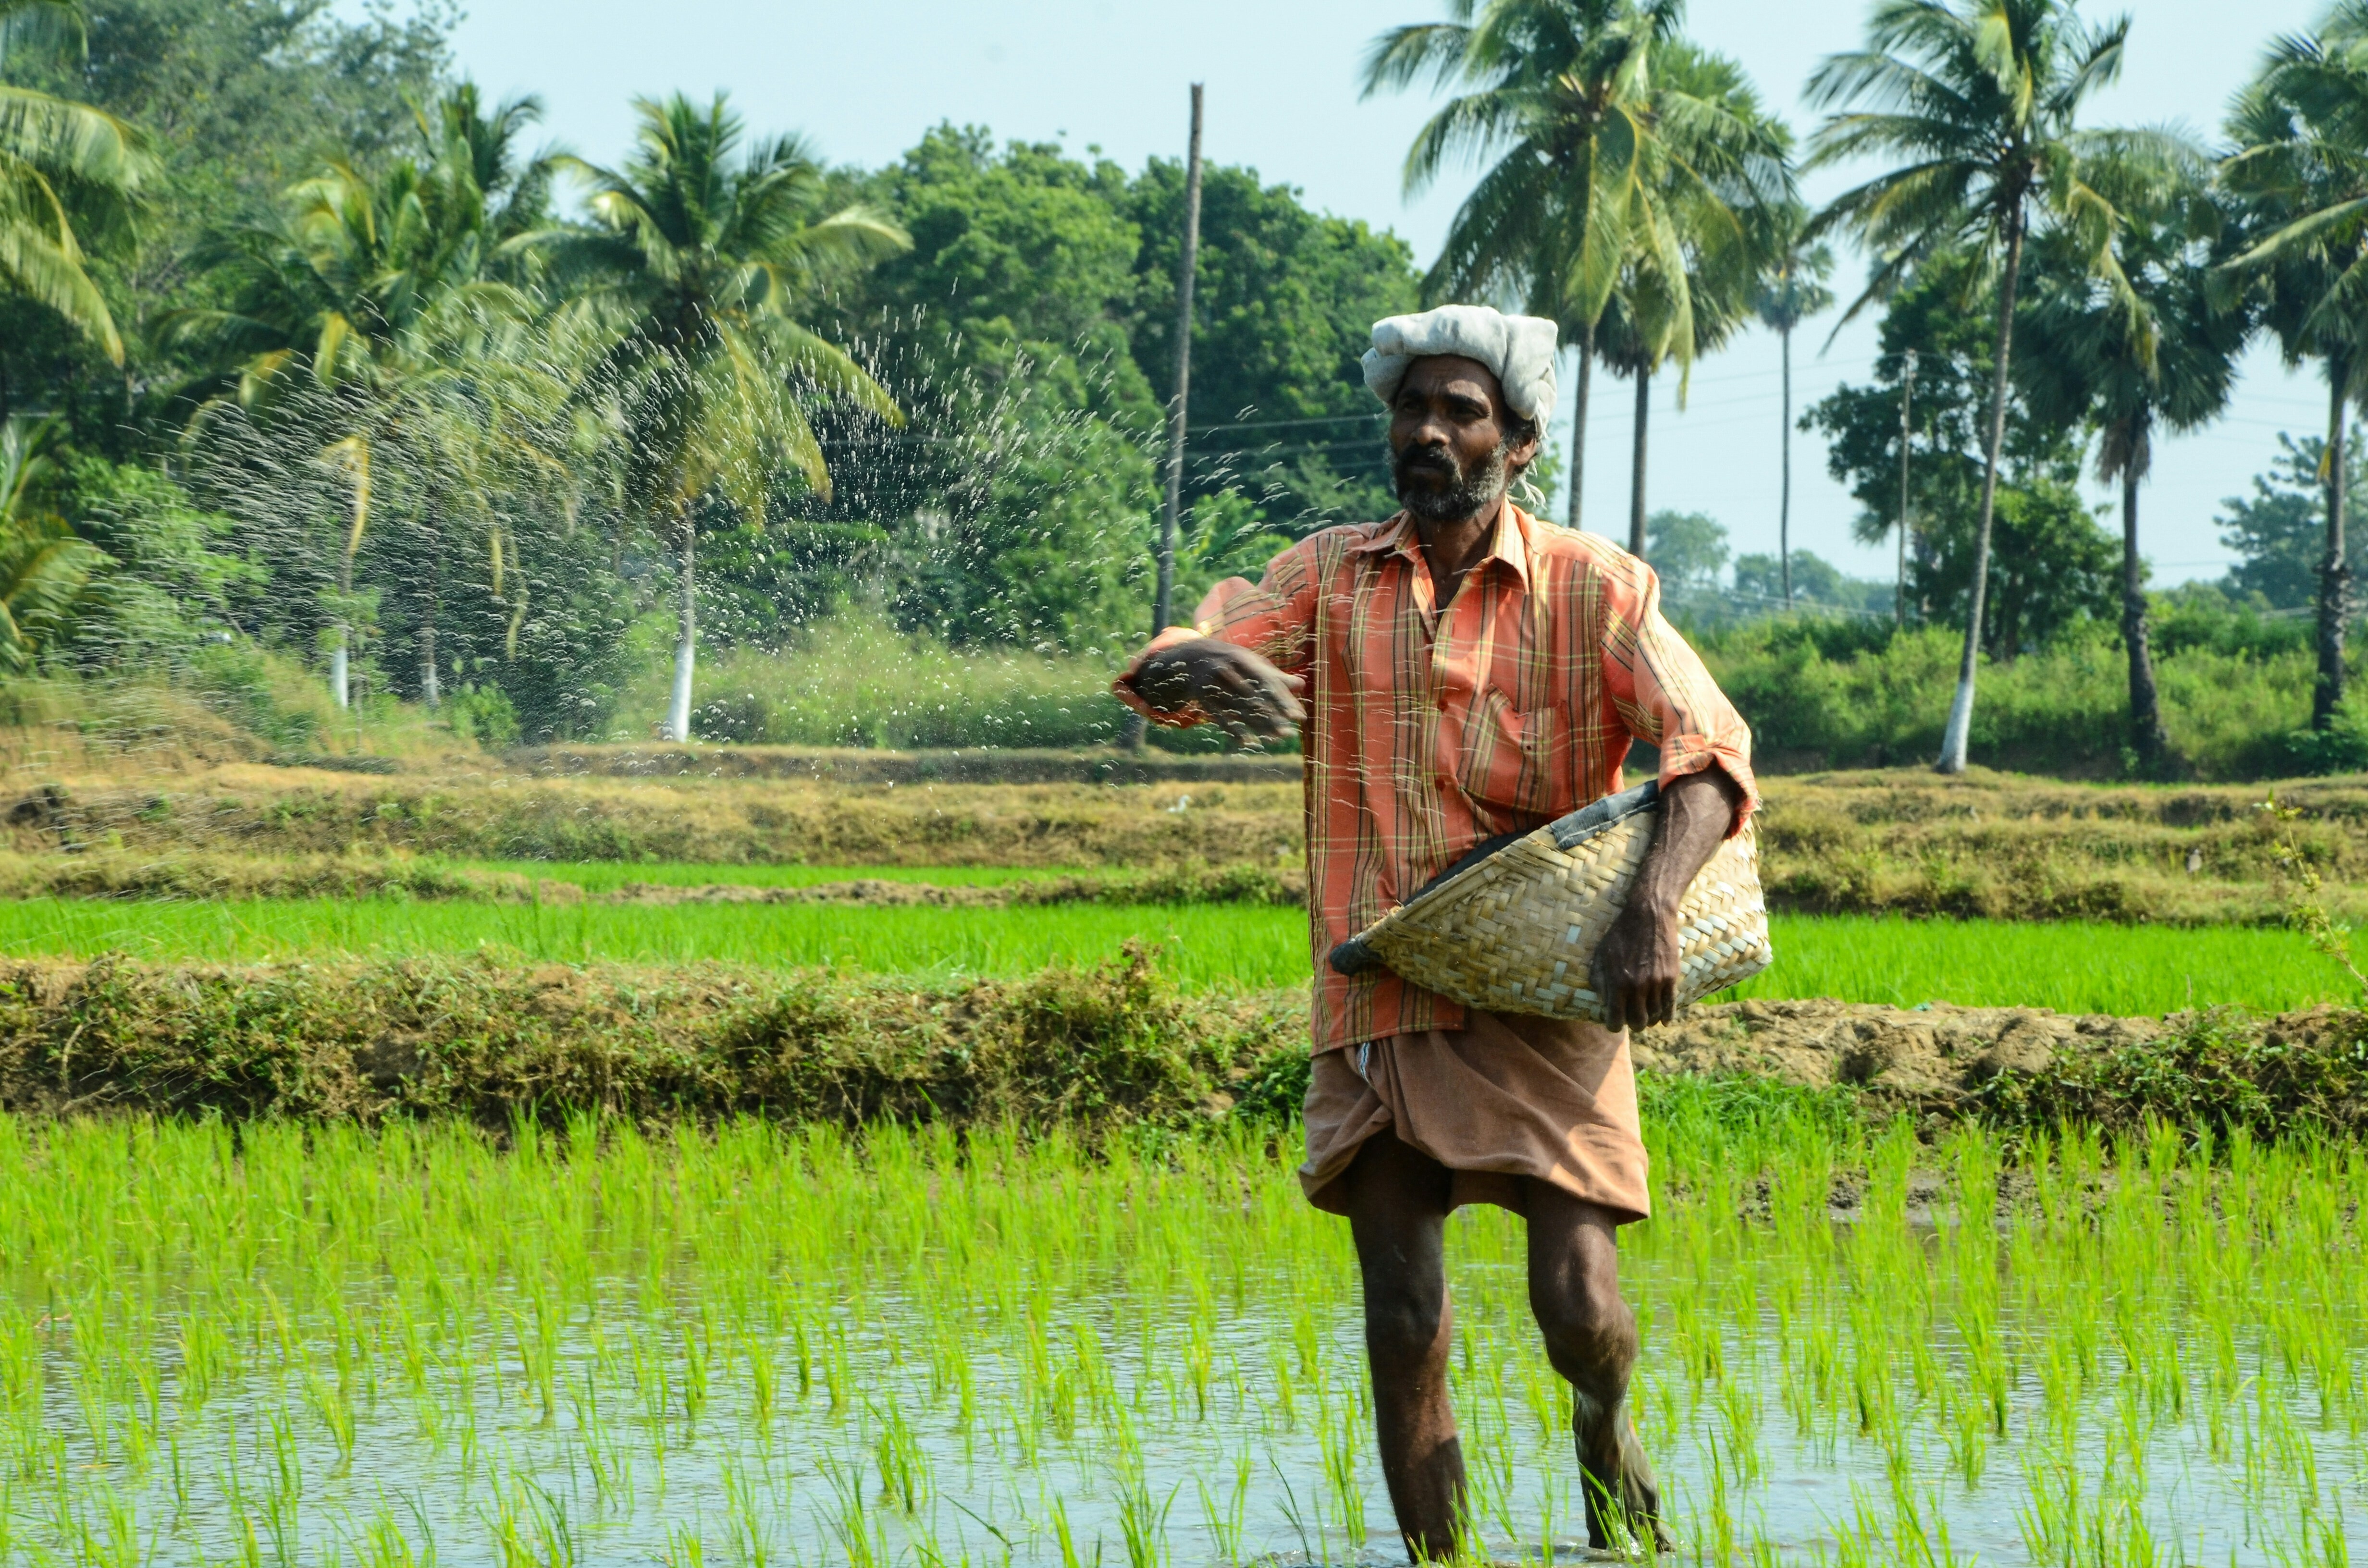
These six charts outline the scale of biodiversity loss - and what can be done to reach the nature-positive target. Image: Unsplash/Alenka Skvarc
Listen to the article
- The head of the WWF has called for the world to adopt a goal of being “nature positive” by 2030.
- The WWF’s Living Planet Report 2022 finds wildlife populations have declined by an average 69% in the past 50 years.
- These six charts outline the scale of biodiversity loss - and what can be done to reach the nature-positive target.
“The planet is in the midst of a biodiversity and climate crisis… and we have a last chance to act… A nature-positive future needs transformative - game changing - shifts in how we produce, how we consume, how we govern, and what we finance.”
So says Marco Lambertini, the Director-General of WWF International in the conservation charity’s Living Planet Report 2022.
Looking ahead to the COVID-19-delayed United Nations’ Convention on Biological Diversity meeting (COP15) in Canada in December, Lambertini calls for the world to adopt a goal of being “nature positive” - actively restoring the planet’s living species rather than just halting their loss - by 2030.
Here are six charts from the report, which explain the extent of nature loss and what can be done to achieve the goal of becoming nature positive.
1. A two-thirds drop in abundance

The Living Planet Index looks at 32,000 populations of 5,230 animal species across the globe.
In the most comprehensive index to date, tracking the health of nature over 50 years, WWF and the ZSL (Zoological Society of London) Institute of Zoology, find an average 69% decline in wildlife populations around the world between 1970 and 2018.
But the extent of decline varies in different parts of the world and between species, with Latin America showing the greatest regional decline in average population abundance at 94%, while freshwater species populations have seen the greatest overall global decline (83%), according to the report.
How does the World Economic Forum encourage biological diversity?
“Land-use change is still the biggest current threat to nature, destroying or fragmenting the natural habitats of many plant and animal species on land, in freshwater and in the sea,” says Lambertini.
“However, if we are unable to limit warming to 1.5°C, climate change is likely to become the dominant cause of biodiversity loss in the coming decades.”
2. Species most under threat of extinction
The chart above shows which species are considered to be most at risk of extinction, according to the International Union for Conservation of Nature (IUCN) Red List of Threatened Species.
The IUCN evaluates 140,000 species by population and how they have changed over time, and creates a Red List Index of relative survival probability.
An ancient group of plants known as cycads are most under threat and corals are the fastest declining of species that have been assessed at least twice.
3. Where biodiversity is most intact
The Biodiversity Intactness Index (BII) estimates how much of an area’s natural biodiversity remains, helping us to understand past, current and future changes to nature, write Andy Purvis, of London’s Natural History Museum and Samantha Hill, of the UN Environment Programme’s World Conservation Monitoring Centre.
In the map above, the darkest areas indicate those with a BII of between 90-100%, where the area has “enough biodiversity to be a resilient and functioning ecosystem”.
At the lightest end of the spectrum, the pale orange and yellow-shaded areas indicate a BII of less than 30%, which means the biodiversity has been “depleted and the ecosystem could be at risk of collapse”.
4. Humanity’s ecological footprint
In 2020, we overused our planet’s resources by at least 75%, or the equivalent to living off 1.75 Earths, according to the Global Footprint Network.
This is a measure of our Ecological Footprint, the demand humans put on Earth’s “biocapacity” - or the ability of ecosystems to regenerate.
The above chart shows that almost two-thirds (60%) of our Ecological Footprint is made up of our carbon footprint, which measures the emissions we generate from burning fossil fuels producing cement by converting them into “forest areas needed to sequester the emissions not absorbed by oceans”.
5. Bending the curve on biodiversity loss

Recovery is possible, as the above chart shows, but bending the curve for biodiversity will require ambitious targets that not only accelerate conservation and restoration, but also address drivers of biodiversity loss.
The report says these include more sustainable production and consumption practices, such as: “sustainable increases in yield and trade, reduction of waste, and the adoption of a higher share of plant-based products in our diets” to limit the expansion of land use in future.
Crucially, we cannot reduce the loss of biodiversity without keeping global warming below
2°C (or preferably 1.5°C), which will need decarbonization at speed in all sectors, from energy to agriculture.
6. Towards a nature-positive future
The report concludes that momentum is building towards reversing biodiversity loss this decade, led by the Leaders’ Pledge for Nature, signed by more than 90 world leaders, from economies representing 39% of global GDP.
Securing a nature-positive world by 2030 “must be our guiding star, in the same way that the goal of limiting global warming to 2°C, and preferably 1.5°C, guides our efforts on climate”.
Don't miss any update on this topic
Create a free account and access your personalized content collection with our latest publications and analyses.
License and Republishing
World Economic Forum articles may be republished in accordance with the Creative Commons Attribution-NonCommercial-NoDerivatives 4.0 International Public License, and in accordance with our Terms of Use.
The views expressed in this article are those of the author alone and not the World Economic Forum.
Stay up to date:
Future of the Environment
Forum Stories newsletter
Bringing you weekly curated insights and analysis on the global issues that matter.


